AreaSeriesView Class
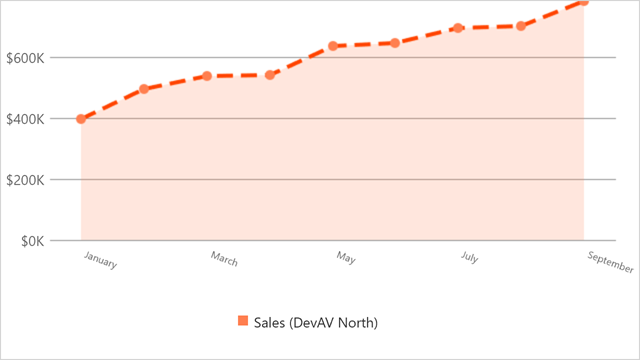
Displays series data points as an Area chart.
Namespace: DevExpress.WinUI.Charts
Assembly: DevExpress.WinUI.Charts.v22.1.dll
NuGet Package: DevExpress.WinUI
Declaration
public class AreaSeriesView :
    MarkerSeriesView,
    IStepSeriesView,
    ISeriesView,
    IPatternHolder,
ISupportPercentValueRemarks
Define the Series.View property to assign a specific view to the series.
Example
The following example shows how to create an Area chart:
<Window
    x:Class="ChartApp.MainWindow"
    xmlns="http://schemas.microsoft.com/winfx/2006/xaml/presentation"
    xmlns:x="http://schemas.microsoft.com/winfx/2006/xaml"
    xmlns:local="using:ChartApp"
    xmlns:d="http://schemas.microsoft.com/expression/blend/2008"
    xmlns:mc="http://schemas.openxmlformats.org/markup-compatibility/2006"
    xmlns:Charts="using:DevExpress.WinUI.Charts"
    xmlns:dxd="using:DevExpress.WinUI.Drawing"
    mc:Ignorable="d">
    <Grid>
        <Grid.DataContext>
            <local:ChartViewModel/>
        </Grid.DataContext>
        <Charts:CartesianChart x:Name="chart" ToolTipEnabled="True">
            <Charts:CartesianChart.Series>
                <Charts:Series x:Name="seriesDevAVNorth" DisplayName="Sales (DevAV North)">
                    <Charts:Series.View>
                        <Charts:AreaSeriesView ToolTipPointPattern="{}{A:MMMM, d}: {V:f2}K"
                                               ToolTipSeriesPattern="{}{S}"
                                               ShowMarkers="True"
                                               ShowContour="True"
                                               Brush="Coral"
                                               Transparency="50">
                            <Charts:AreaSeriesView.ContourAppearance>
                                <Charts:ContourAppearance Brush="OrangeRed">
                                    <Charts:ContourAppearance.StrokeStyle>
                                        <dxd:StrokeStyle DashArray="4 2" Thickness="4"/>
                                    </Charts:ContourAppearance.StrokeStyle>
                                </Charts:ContourAppearance>
                            </Charts:AreaSeriesView.ContourAppearance>
                        </Charts:AreaSeriesView>
                    </Charts:Series.View>
                    <Charts:Series.Data>
                        <Charts:DataSource PointSource="{Binding DataPoints}"
                                           ArgumentDataMember="Date"
                                           ValueDataMember="Total"/>
                    </Charts:Series.Data>
                </Charts:Series>
            </Charts:CartesianChart.Series>
            <Charts:CartesianChart.Legend>
                <Charts:Legend HorizontalPosition="Center"
                               VerticalPosition="BottomOutside"/>
            </Charts:CartesianChart.Legend>
            <Charts:CartesianChart.AxisX>
                <Charts:AxisX ShowLabels="True"
                              LabelPattern="{}{V:MMMM}"
                              LabelAngle="20">
                    <Charts:AxisX.LabelTemplate>
                        <DataTemplate>
                            <TextBlock FontSize="10"
                                       Text="{Binding Text}"
                                       Foreground="Black"/>
                        </DataTemplate>
                    </Charts:AxisX.LabelTemplate>
                </Charts:AxisX>
            </Charts:CartesianChart.AxisX>
            <Charts:CartesianChart.AxisY>
                <Charts:AxisY ShowLabels="True"
                              LabelPattern="${V}K"/>
            </Charts:CartesianChart.AxisY>
        </Charts:CartesianChart>
    </Grid>
</Window>
using DevExpress.Mvvm;
using Microsoft.UI.Xaml;
using System;
using System.Collections.Generic;

namespace ChartApp {
    public sealed partial class MainWindow : Window {
        public MainWindow() {
            this.InitializeComponent();
        }
    }
    public class DataPoint {
        public DateTime Date { get; set; }
        public double Total { get; set; }
    }
    public class ChartViewModel : ViewModelBase {
        public ChartViewModel() {
            List<DataPoint> dataPoints = new List<DataPoint> {
                new DataPoint() { Date = new DateTime(2020, 01, 01), Total = 396.45 },
                new DataPoint() { Date = new DateTime(2020, 02, 01), Total = 496.253 },
                new DataPoint() { Date = new DateTime(2020, 03, 01), Total = 536.45 },
                new DataPoint() { Date = new DateTime(2020, 04, 01), Total = 539.632 },
                new DataPoint() { Date = new DateTime(2020, 05, 01), Total = 634.42 },
                new DataPoint() { Date = new DateTime(2020, 06, 01), Total = 645.637 },
                new DataPoint() { Date = new DateTime(2020, 07, 01), Total = 696.1 },
                new DataPoint() { Date = new DateTime(2020, 08, 01), Total = 701.756 },
                new DataPoint() { Date = new DateTime(2020, 09, 01), Total = 782.822 }
            };
            DataPoints = dataPoints;
        }
        public List<DataPoint> DataPoints { get; }
    }
}
For step-by-step instructions on how to create a Cartesian chart, refer to the following help topic: Lesson 1 - Create a Cartesian Chart.
Inheritance
Object
DependencyObject
UIElement
FrameworkElement
DevExpress.WinUI.Core.Internal.DXLogicalFrameworkElement
See Also