Lesson 2: Create Grid Columns
- 4 minutes to read
This document contains an overview of the DataGridView‘s columns and provides an example on how to specify columns for the grid created in Lesson 1.
Grid Columns - Overview
DataGridView represents fields and records of the underlying data source as columns and rows. To specify data the grid should display, create columns and bind them to data fields.
A grid stores columns in the DataGridView.Columns collection. An individual column is specified by a GridColumn class descendant that corresponds to the type of data this column displays. The following table lists the supported column types:
Column Type | Description |
|---|---|
A grid column used to display and edit numeric values. | |
A grid column used to display and edit text values. | |
A grid column used to display and edit text values. The column suggests values as a user types in a cell. | |
A grid column used to display and edit text values. The column displays a drop-down list that contains available values. | |
A grid column used to display and edit date values. | |
A grid column used to display and edit the time. | |
A grid column that displays Boolean values and allows a user to change a cell value by switching between two states. | |
A grid column used to display images. | |
A grid column that allows a user to edit a cell value by selecting an item from the predefined set. | |
A column type that allows you to define a custom template for column cells. |
Each column object provides a set of properties to adjust column settings (for example, data display format, column width, header caption, content alignment), and manage grid data (sort, group, and filter).
Columns can be added to a grid and associated with the bound data source’s fields in the following ways:
The grid creates columns for all fields of the bound data source.
A DataGridView instance automatically generates columns based on the bound data source - one column for one field of a data source object, except for complex fields (fields of nested objects). The order of columns in the grid is the same as the order of fields in the data source. You can use the DataGridView.AutoGenerateColumnsMode property to prevent columns from being automatically created or set another mode of auto generating columns.
You can create columns and bind them to fields.
You can specify a collection of grid columns. To do this, create column objects, use the GridColumn.FieldName property to bind each column to the corresponding data field, and add columns to the DataGridView.Columns collection in the order you want them to be displayed in the grid.
In addition to columns bound to data source fields, you can create unbound columns to display data values calculated based on the values of other columns. To create an unbound column in the grid, add a column object that corresponds to the type of data the column should display to the DataGridView.Columns collection, and set the following column properties:
- FieldName - a unique string that does not match any field name in the grid’s underlying data source.
- UnboundType - the type of data the column should display (Boolean, DateTime, Decimal, Integer, String or Object).
- UnboundExpression - a formula (string expression) that automatically calculates the column’s values.
Create Grid Columns - Example
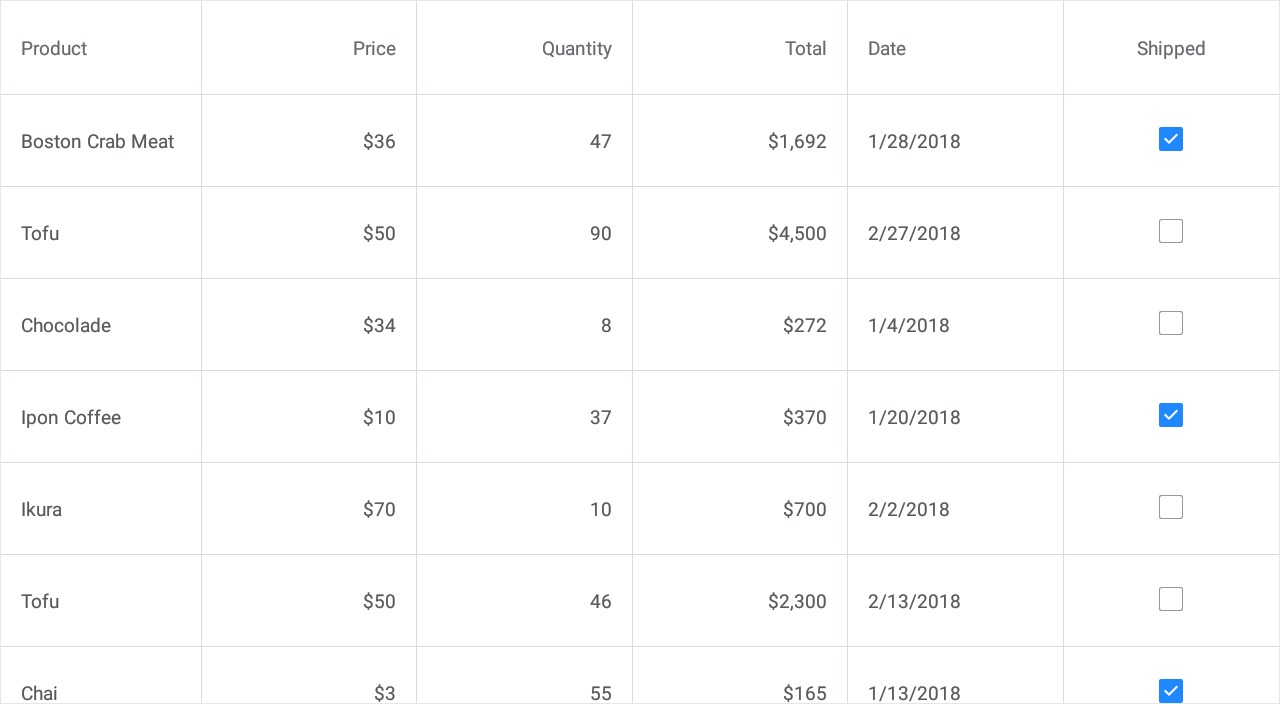
Open the solution created in Lesson 1 and add columns to the grid to display the following information:
Product Name and Unit Price
TextColumn and NumberColumn - columns bound to the Product.Name and Product.UnitPrice properties of a product related to an order (complex fields).
Quantity
NumberColumn - a column bound to the order’s Quantity property.
Total
NumberColumn - an unbound column that displays each order amount calculated according to the expression: Quantity*UnitPrice.
Date
DateColumn - a column bound to the order’s Date property.
Shipped
CheckBoxColumn - a column bound to the order’s Shipped property.
<dxg:DataGridView x:Name="grid" ItemsSource="{Binding Orders}">
    <dxg:DataGridView.Columns>
        <dxg:TextColumn FieldName="Product.Name" Caption="Product" Width="150" />
        <dxg:NumberColumn FieldName="Product.UnitPrice" Caption="Price"
                          DisplayFormat="C0" MinWidth="100"/>
        <dxg:NumberColumn FieldName="Quantity" MinWidth="100"/>
        <dxg:NumberColumn FieldName="Total"
                          UnboundType="Integer" UnboundExpression="[Quantity] * [Product.UnitPrice]"
                          IsReadOnly="True" DisplayFormat="C0" MinWidth="100"/>
        <dxg:DateColumn FieldName="Date" DisplayFormat="d" MinWidth="100"/>
        <dxg:CheckBoxColumn FieldName="Shipped" MinWidth="100"/>
    </dxg:DataGridView.Columns>
</dxg:DataGridView>
The grid now displays information on orders retrieved from the bound data source and calculates each order.

The next lesson explains how to group data in the grid.
Tip
See the following section in the DataGridView topic for more information: Columns.