Obtain Underlying and Displayed Data in Dashboard Control for JavaScript Applications
- 6 minutes to read
The Web Dashboard’s client API allows you to access two types of data: client data displayed within dashboard items and underlying data from the dashboard data source.
Client Data
The dashboard aggregates and visualizes data from the underlying data source (for instance, external databases or lists of data created at runtime).
Each data-bound dashboard item uses a multidimensional representation of data and aggregates underlying data based on dimensions. Measure and delta values are calculated at the intersection of these dimensions. Dashboard items visualize dimension values and corresponding measure/delta values.
Call the ViewerApiExtension.getItemData method to access a hierarchical representation of this data on the client.
Client Data Structure
The ItemData object contains hierarchical data displayed within the dashboard item and provides access to the following objects:
- ItemDataAxisPoint
- Stores points in a multidimensional space. A point is a dimension value that corresponds to a specific hierarchy level.
- ItemDataAxis
- A data axis that contains a set of points. For instance, the pivot grid has the “Row” and “Column” data axes, the chart has the “Argument” and “Series” data axes, and so forth. The DashboardDataAxisNames class lists constants used to identify the data axis type.
See the image below that shows how the ItemData object stores hierarchical data:

Metadata
The ItemData object allows you to obtain data member identifiers, formatting options, data item name, and other settings of dimensions and measures. Call the following methods to get data items:
- getDimensions
- Returns the dimensions that correspond to the specified axis.
- getMeasures
- Returns measures.
- getDeltas
- Returns information about deltas (for the Grid, Card, Gauge, and Choropleth Map dashboard items).
Dimension Values
Obtain axis points placed on the data axis to access dimension values. For this, call the ItemData.getAxis method and pass the data axis name as a parameter. The returned ItemDataAxis object exposes the ItemDataAxis.getPoints method that returns axis points belonging to the current axis.
Use the following ItemDataAxisPoint methods to obtain dimension values for these axis points:
- getValue
- Gets the value corresponding to the current axis point.
- getDisplayText
- Gets the display text corresponding to the current axis point.
- getUniqueValue
- Gets the unique value corresponding to the current axis point.
Slice
You can describe the slice of the ItemData object as the ItemDataAxisPointTuple instance that contains a set of axis points from different data axes. For this, call the ItemData.getSlice method and pass the point tuple as a parameter to get the slice of the current ItemData object by the specified axis point.
Take a look at the image of how hierarchical data is stored again. The slice by the axis point corresponding to “Product 3” allows you to obtain summary values for all date intervals (horizontal area highlighted in green). The slice by the axis point corresponding to “May” contains summary values for all products (vertical area highlighted in blue).
Call the ItemData.getSlice method two sequential times to obtain the slice at the intersection of the “Product 3” and “May” axis points.
Measure Values
- Measure
You can obtain total summary values or summary values at the intersection of multiple axis points. For this, call the ItemData.getMeasureValue(measureId) method and pass the measure identifier (the ItemDataMeasure.id property value). You can get this identifier if you call the ItemData.getMeasures method.
For a measure, you can get its value and display text. See the ItemDataMeasureValue class member for details.
- Delta
To obtain delta values, use the ItemData.getDeltaValue(deltaId) method and pass the delta identifier (the ItemDataDelta.id property) as a parameter. Use the ItemData.getDeltas method to get delta identifiers.
For delta values, you can get actual/target values, various delta settings, and other multiple options. See the ItemDataDeltaValue class member for details.
Note
You can use the ItemData.getMeasureValue method to obtain summary values for hidden measures.
Example: Obtain a Dashboard Item’s Client Data
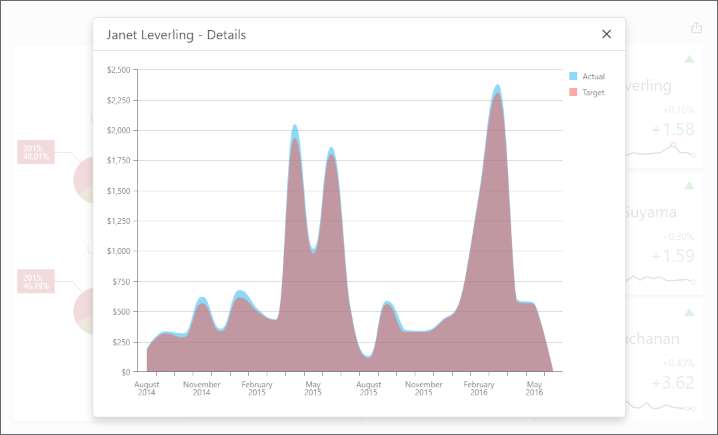
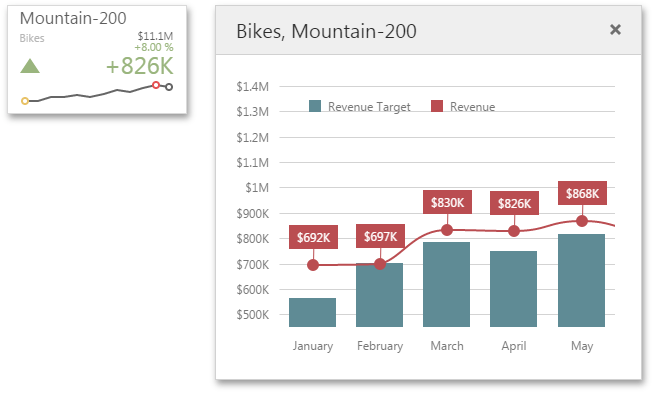
The following example uses the DashboardControl‘s client-side API to obtain client data that corresponds to a particular visual element. When you click a card, the dxChart displays the detailed chart and shows a variation of actual/target values over time.
Underlying Data
The dashboard visualizes aggregated data from the underlying data source.
Call the ViewerApiExtension.requestUnderlyingData method and pass axis points or data members as parameters to obtain underlying data for a specific dashboard item or its elements.
Note
The requestUnderlyingData method returns only non-aggregated data values.
Example: Obtain Underlying Data for the Specified Dashboard Item
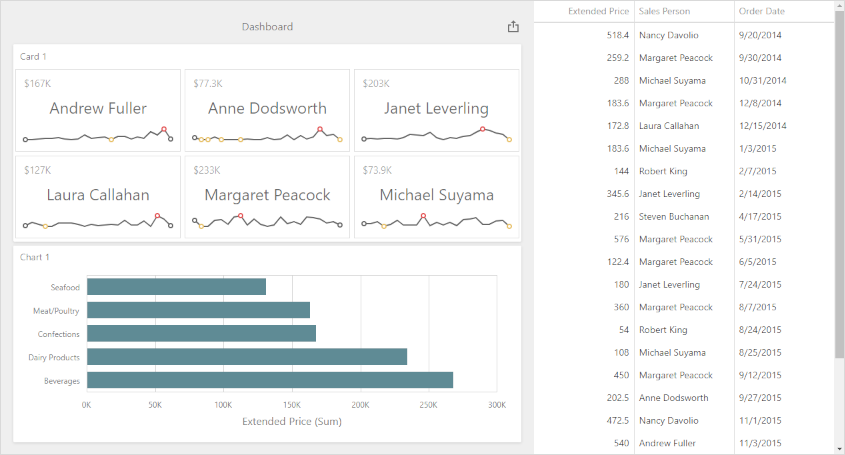
The example shows how to get underlying data for the specified dashboard item. Underlying data is displayed in the dxDataGrid widget placed next to the Web Dashboard.
Example: Obtain a Dashboard Item’s Underlying Data for a Clicked Visual Element
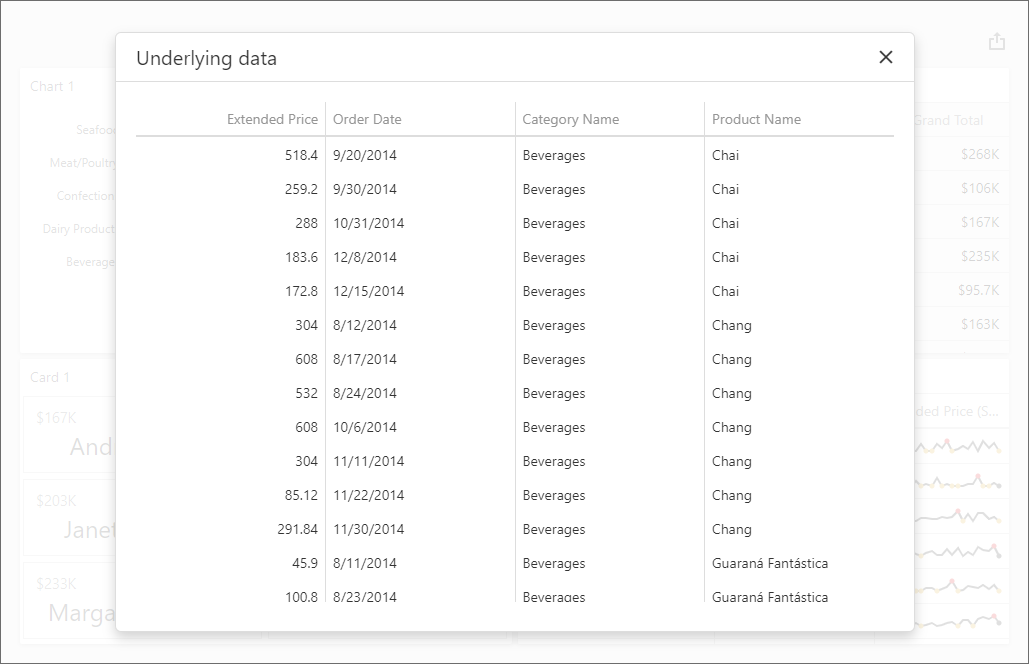
The example gets underlying data that corresponds to a particular visual element and displays this data in the dxPopup widget with the child dxDataGrid.
Example: Obtain a Custom Item’s Underlying Data for a Clicked Visual Element
This example shows how to obtain underlying data in a custom dashboard item when a user clicks the item’s visual element. The custom item is based on the Funnel D3 item.
Events
The Web Dashboard control has events that allow you to obtain client and underlying data related to the clicked visual element. You can use this data to implement custom interactivity between dashboard items.
For instance, the chart series points in the image below are obtained based on the axis points placed on the Sparkline of the clicked card.
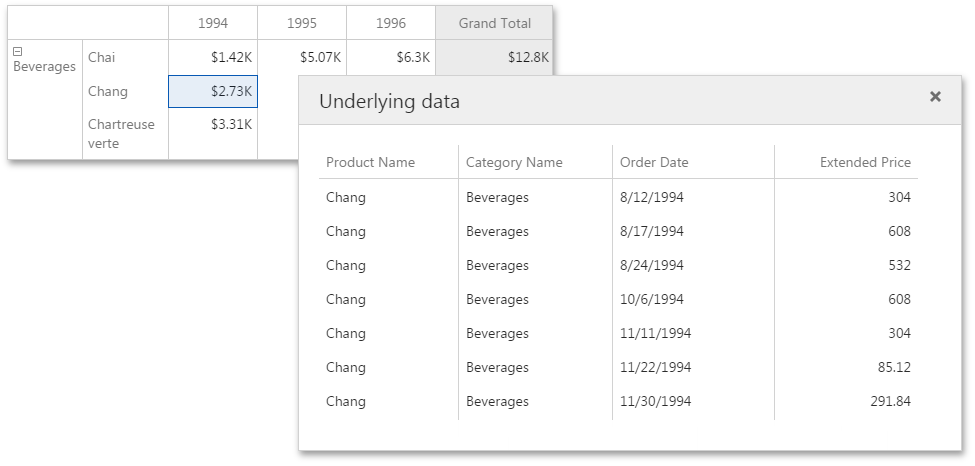
The grid in the image below displays underlying data related to the clicked pivot cell.
Handle the ViewerApiExtensionOptions.onItemClick event to access underlying and client data.
In the event handler, you can use the following members to get data:
- e.getAxisPoint
- Returns the axis point related to the clicked visual element.
- e.getData
- Returns the client data of the dashboard item for which the event is raised.
- e.requestUnderlyingData
- Returns underlying data that corresponds to the clicked visual element.