Manage Data Inspector in the Dashboard Control for JavaScript Applications
- 4 minutes to read
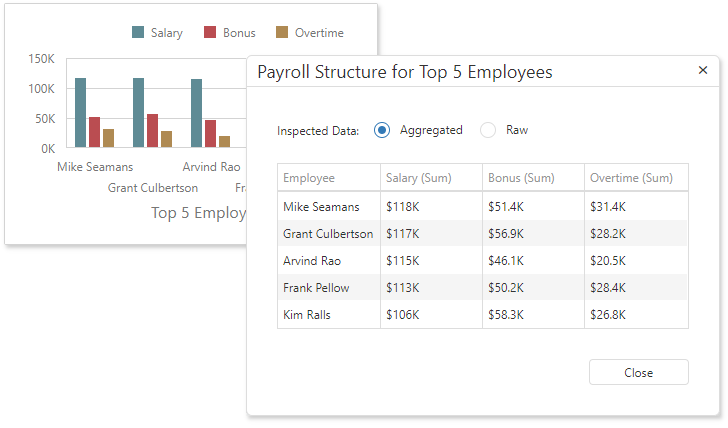
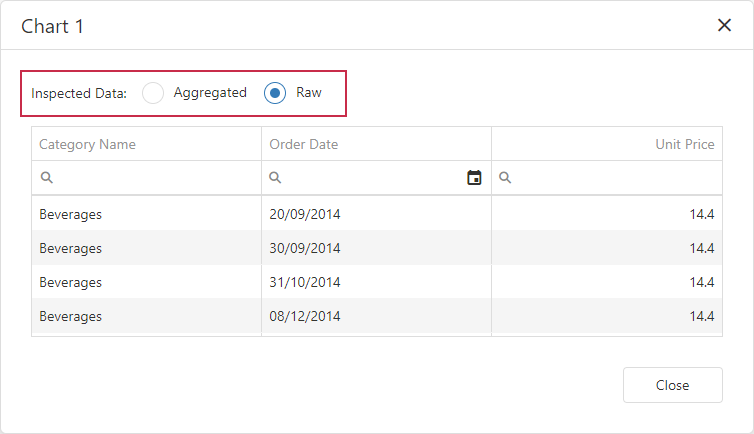
Data Inspector is a dialog window that displays raw or aggregated data. The window can contain one or two grids depending on chosen options. A user can employ the radio group located at the window top to switch between grids.

Data Inspector is a Web Dashboard extension. You can access the DataInspectorExtension class and its options to configure it.
Aggregated and Raw Data
- Aggregated Data
- Aggregated Data is retrieved from the dashboard item’s data storage that is the MultiDimensionalData object. For more information on how Aggregated Data is displayed in Data Inspector, refer to the following article: Aggregated Data.
- Raw Data
- Raw data is the dashboard item’s underlying data. For more information on how Aggregated Data is displayed in Data Inspector, refer to the following article: Raw Data.
For more information on underlying and displayed data in the Dashboard Control for JavaScript Applications, refer to the following article: Underlying and Displayed Data.
Enable Data Inspector
The Inspect Data button is initially hidden. To show it, set one of the following properties to true depending on the data you want to display:
- DataInspectorExtensionOptions.allowInspectAggregatedData
- DataInspectorExtensionOptions.allowInspectRawData
window.onload = function () {
    var dashboardControl = new DevExpress.Dashboard.DashboardControl(document.getElementById("web-dashboard"), {
        endpoint: "/api/dashboard",
        extensions: {
            'dataInspector': {
                allowInspectAggregatedData: true,
                allowInspectRawData: true
            }
        }
    });
    dashboardControl.render();
};
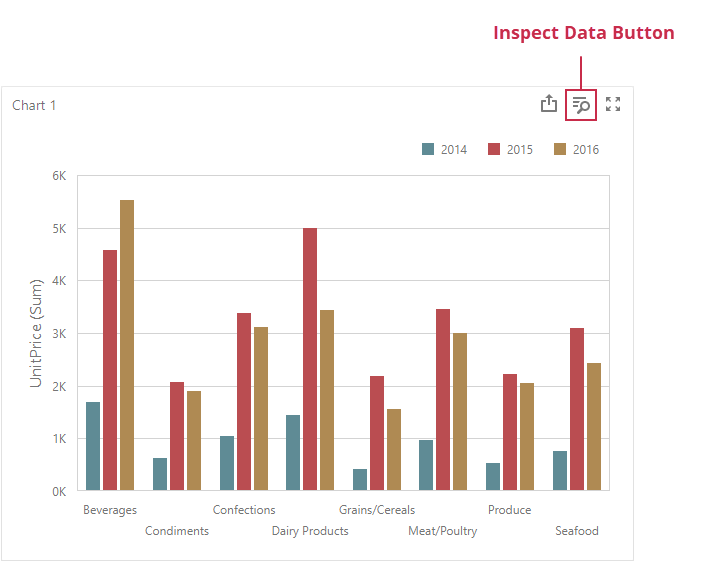
To invoke the Data Inspector window in the UI, click the Inspect Data button in the dashboard item caption:

When only one property is set to true, the window contains a single grid with raw or aggregated data, depending on what property is enabled. The window caption displays the dashboard item caption text and the inspected item type (raw or aggregated) in parentheses.
When both properties are set to true, the window contains two grids with raw and aggregated data and allows a user to switch between them. The window caption displays the dashboard item caption text.

Data Inspector can display hidden measures but does not display hidden dimensions. You can add data members to the Hidden Measures section to display them only in the Data inspector and keep visual data unchanged.
Customize Data Inspector
To customize the Data Inspector dialog, use the DataInspectorExtensionOptions API:
- onGridContentReady
- A handler for the event that occurs after the Grid widget’s content is loaded.
- onGridInitialized
- A handler for the event that occurs before the Grid widget’s content is loaded.
- onDialogHidden
- A handler for the event that occurs when the Data Inspector dialog is hidden.
- onDialogShowing
- A handler for the event that occurs before the Data Inspector dialog is shown.
- onDialogShown
- A handler for the event that occurs after the Data Inspector dialog is shown.
You can also use the DataInspectorExtensionEvents members to handle events.
Call the DataInspectorExtension.showDataInspector method to invoke the Data Inspector dialog.
Export Data
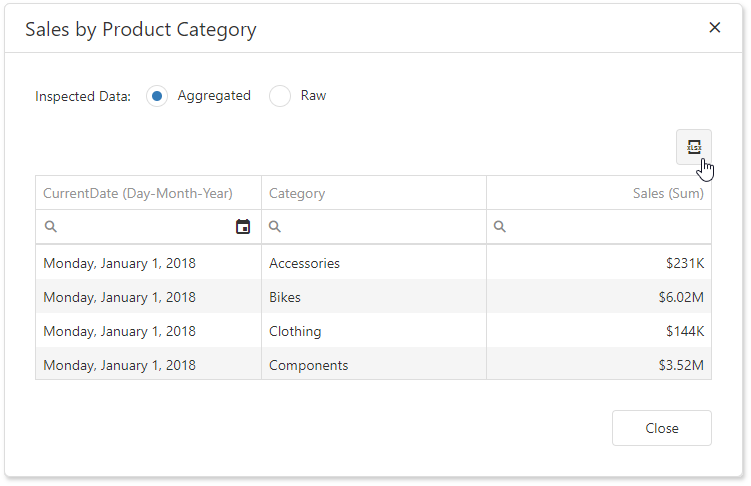
Data Inspector allows you to export data to Excel. To do this, enable export options of the underlying DevExtreme DataGrid instance used to display raw or aggregated data.
The export functionality requires the ExcelJS v4+ and FileSaver v2.0.2+ npm packages. For more details, see Client-Side Exporting topic.
Follow the steps below to enable export:
- Handle the DataInspectorExtensionOptions.onGridInitialized event.
- Use the e.component property to obtain the
dxDataGridinstance. - Set the
dxDataGrid‘s export.enabled option totrue.
extensions:{
    "dataInspector": {
        allowInspectAggregatedData: true,
        allowInspectRawData: true,
        onGridInitialized: onGridInitialized
    }
}
Data Inspector displays the Export to Excel button when you enable export:

For more information about this functionality, its prerequisites and restrictions, refer to the following topic: Client-Side Exporting.