Conditional Formatting
- 3 minutes to read
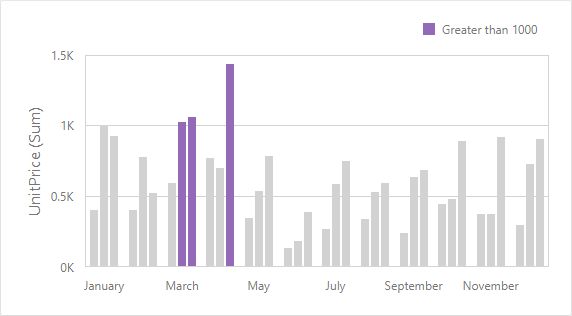
Use conditional formatting to highlight chart elements such as bars, lines, areas, and data points.
The following series types support conditional formatting:
- Bar
- Point/Line
- Area
- Bubble
- Range Bar
Supported Format Rules
You can use the following data in rule calculations:
- measures from the Values section
- dimensions from the Arguments/Series section
- hidden measures
The following table lists available format rules and corresponding data types:
Data Type | Supported Format Rules |
|---|---|
numeric | |
string | Value with the condition type set to Equal To, Not Equal To or Text that Contains |
date-time |
A Date Occurring for dimensions with the continuous date-time group interval |
Refer to the following topic for more information about format condition types: Conditional Formatting Basics
Create and Edit a Format Rule
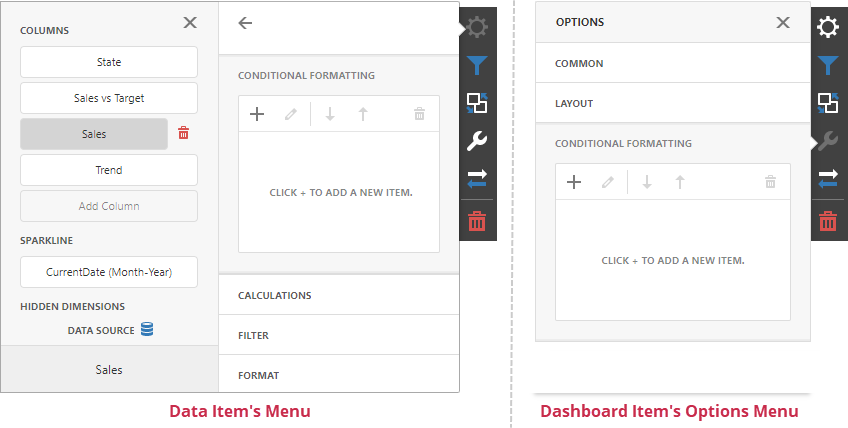
To create or edit a format rule, open the Conditional Formatting section in the data item menu or in the dashboard item’s Options menu. Click + to add a new format rule:
Refer to the following topic for more information on how to create and edit format rules: Conditional Formatting in Web Dashboard
Chart-Specific Format Condition Settings
Specify appearance settings and set the condition’s value to create a format rule. Available settings depend on the selected format condition type.
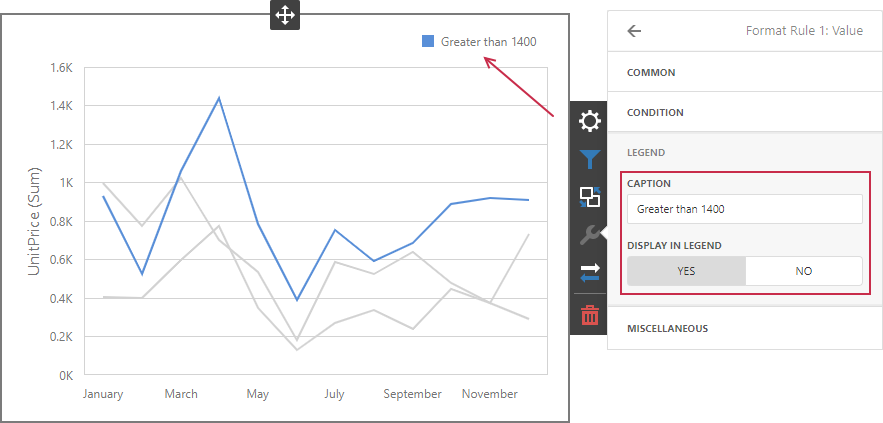
The image below displays the Value rule settings. The condition colors points/bars if their values exceed 1400:
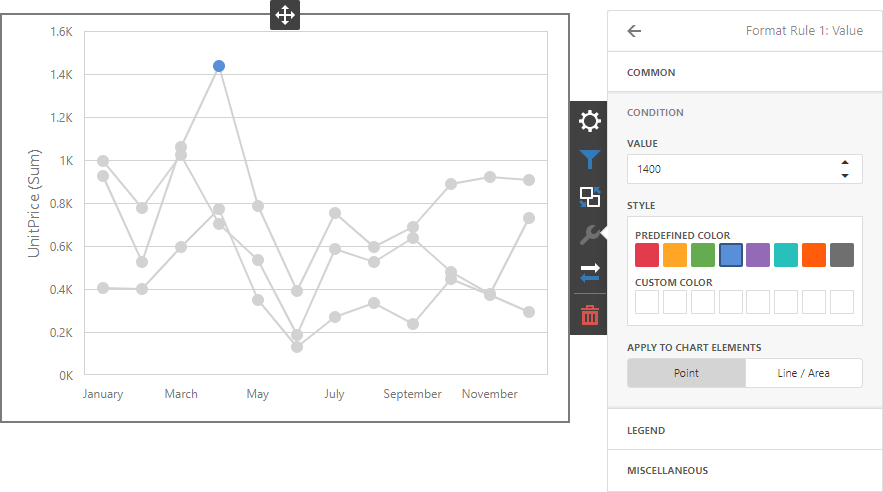
You can apply one of the predefined colors or set a custom color for this condition.
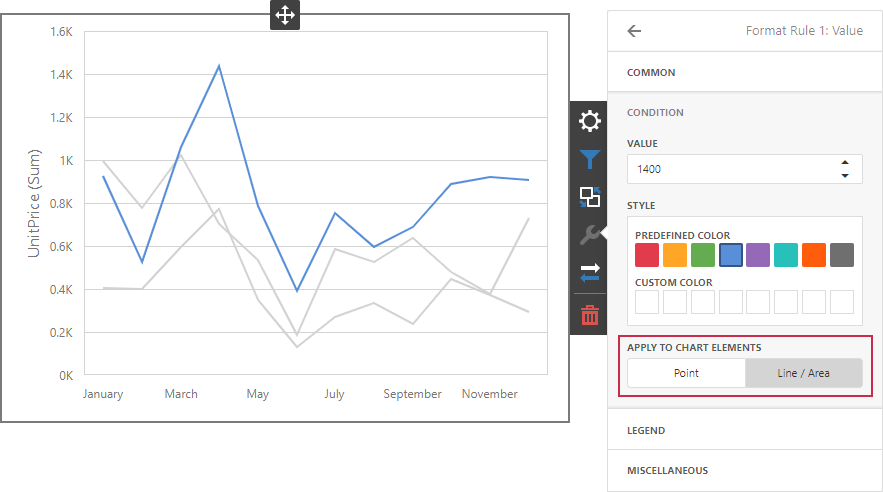
Use the Apply to chart elements button group to apply a rule on points or lines.
- Point: A rule applies to the data-points such as bars, points and bubbles.
- Line / Area: A rule applies to lines and areas.
If you select Line / Area, the format rule applies to the line when at least one line point meets the rule’s condition:
Go to the rule’s Legend section and set the Caption field to specify the legend’s text. It enables the Display in Legend option and the Chart item displays information about the applied rule in the legend:
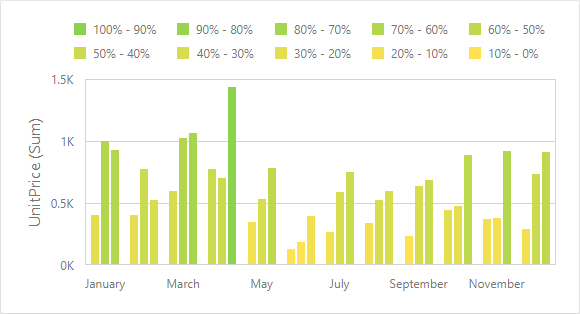
For Range format rules, the legend display text is generated automatically and depends on range intervals:
Coloring
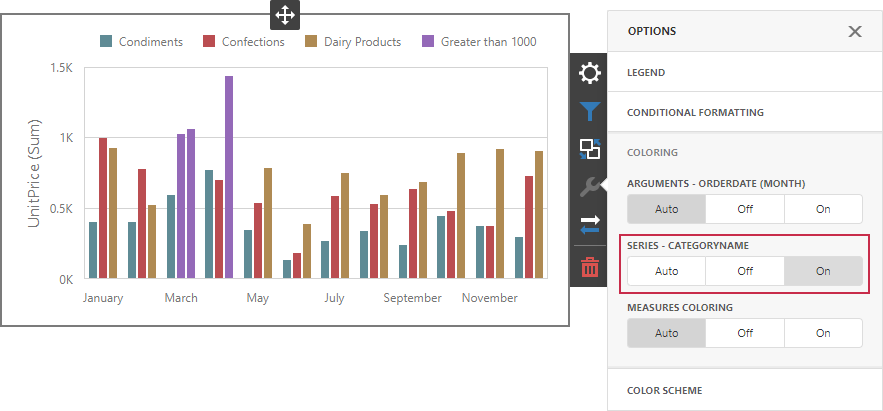
A Chart item paints elements in pale gray if they do not meet the applied format condition. Note that this does not apply to elements that are painted by different hues (the Dimension.coloringMode property is set to Hue).
Enable coloring for series to restore the color scheme:
Tip
Documentation: Web Dashboard - Coloring