Sparkline Column
- 2 minutes to read
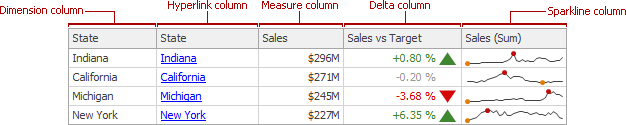
A sparkline column visualizes the variation of summary values over time.
In code, sparkline columns are represented by the GridSparklineColumn class.
Data Binding Specifics
The sparkline column is bound to the measure providing sparkline values and to the dimension providing a numeric or date-time interval.
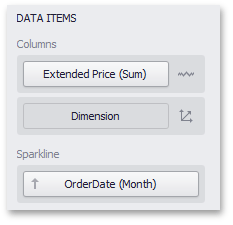
To bind the sparkline column to data in code, do the following.
- Assign the required numeric or date-time Dimension to the GridDashboardItem.SparklineArgument property.
- Assign the required Measure (whose values need to be visualized using sparklines) to the GridSparklineColumn.Measure property.
Sparkline Options
You can control sparkline appearance settings using the Column Options dialog. To invoke this dialog, click the column type indicator ( ).
).
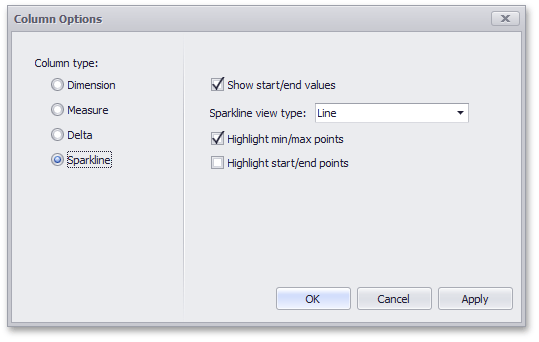
In this dialog, you can control various settings that affect how the sparkline is displayed within a grid cell.
| Sparkline Options | Description | API |
|---|---|---|
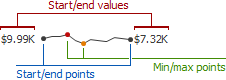
| Show start/end values | Species whether to display sparkline start/end values within a grid cell. | GridSparklineColumn.ShowStartEndValues |
| Sparkline view type | Defines the view type of a sparkline. Sparkline data points can be represented as area, line, bars, or win and loss squares. | SparklineOptions.ViewType |
| Highlight min/max points | Specifies whether to highlight the minimum/maximum points of a sparkline. | SparklineOptions.HighlightMinMaxPoints |
| Highlight start/end points | Specifies whether to highlight the start/end points of a sparkline. | SparklineOptions.HighlightStartEndPoints |
The following code snippet creates the Sparkline column:
var grid = new GridDashboardItem();
grid.DataSource = dataSource;

var gridSparkline = new GridSparklineColumn();
gridSparkline.Measure = new Measure("Count");
gridSparkline.SparklineOptions.ViewType = SparklineViewType.Line;
grid.SparklineArgument = new Dimension("Date", DateTimeGroupInterval.MonthYear);

grid.Columns.Add(gridSparkline);
See Also