Providing Data
- 3 minutes to read
The Web Dashboard allows you to bind dashboard items to data in a uniform and similar manner. See the Bind Dashboard Items to Data in the Web Dashboard’s UI topic for common information.
The difference is in the data sections that the specific dashboard item has. This topic describes how to bind the Gauge dashboard item to data.
Binding to Data in the Web Dashboard
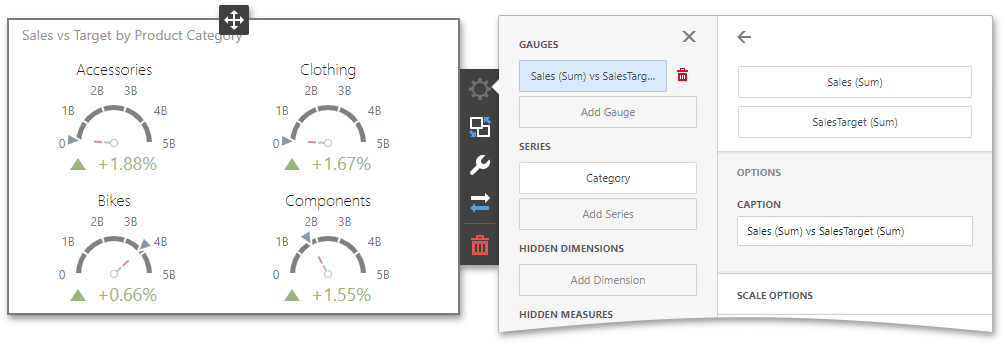
The image below shows a sample Gauge dashboard item that is bound to data.
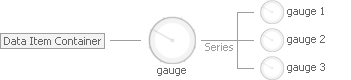
The gauge data binding scheme is the following. If there is no series, only one gauge element (CircularGauge or LinearGauge objects) corresponds to each data item container’s Gauge. When you add series, the number of gauge elements is multiplied by the number of series values. For example, if a series contains three values, each Gauge has three gauge elements:
To bind the Gauge dashboard item to data, click a placeholder contained in one of the available data sections and select the required data source field in the Binding section of the invoked data item menu.
The table below lists and describes the Gauge’s data sections.
Section | API | Processed as | Description |
|---|---|---|---|
Gauges | Measure (both Actual and Target values) | Contains data items used to calculate values displayed by gauges. After you add the data item containing actual data (KpiElement.actualValue), you can add the second data item (optional) that contains target data (KpiElement.targetValue). If both items are provided, gauges show the difference between actual and target values, called delta. To learn more, see Delta. You can add several values in the Gauges section and use the Values drop-down menu to switch between them. To invoke the Values menu, click the | |
Series | Contains data items whose values are used to label gauges.. |
 icon in the
 Example
The following example shows how to create the Gauge dashboard item, bind it to data and add to the existing dashboard.
Create data items (measures and dimensions) and use the DataItem.dataMember property to bind them to the existing data source’s columns. Then use the created measures and dimensions in the dashboard item to bind it to data.
After you add the created dashboard item to the Dashboard.items collection, call the Dashboard.rebuildLayout method to rebuild the dashboard layout and display changes.
// Use the line below for a modular approach:
// import * as Model from 'devexpress-dashboard/model'
// Use the line below for an approach with global namespaces:
// var Model = DevExpress.Dashboard.Model;

// ...
public createGaugeItem() {
    // Create data items for the Gauge dashboard item.
    var gaugeCategory = new Model.Dimension();
    gaugeCategory.dataMember("Category");
    var gaugeRevenueQTD = new Model.Measure();
    gaugeRevenueQTD.dataMember("RevenueQTD");
    var gaugeRevenueQTDTarget = new Model.Measure();
    gaugeRevenueQTDTarget.dataMember("RevenueQTDTarget");

    // Create the Gauge dashboard item and bind it to data.
    var gaugeItem = new Model.GaugeItem();
    var gauge = new Model.Gauge(gaugeItem);

    gaugeItem.name('gauges');
    gaugeItem.dataSource(excelDataSource.componentName());

    gauge.name("gauge");
    gauge.actualValue(gaugeRevenueQTD);
    gauge.targetValue(gaugeRevenueQTDTarget);
    gaugeItem.gauges.push(gauge);

    gaugeItem.seriesDimensions.push(gaugeCategory);

    control.dashboard().items.push(gaugeItem);
    // ...
    control.dashboard().rebuildLayout();
}