Providing Data
- 3 minutes to read
The Web Dashboard allows you to bind dashboard items to data in a uniform and similar manner. See the Bind Dashboard Items to Data in the Web Dashboard’s UI topic for common information.
The difference is in the data sections that the specific dashboard item has. This topic describes how to bind the Chart dashboard item to data.
Binding to Data in the Web Dashboard
The image below shows a sample Chart dashboard item that is bound to data.
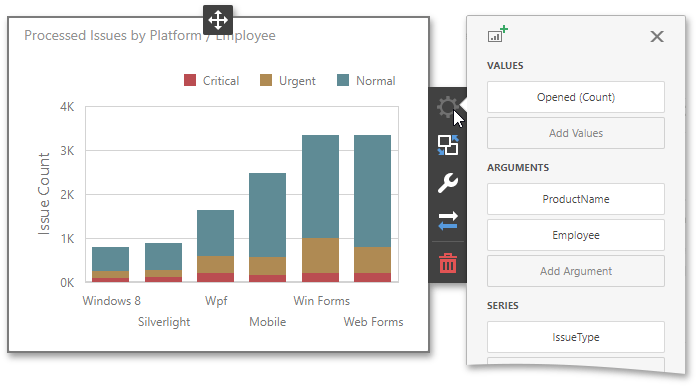
To bind the Chart dashboard item to data, click a placeholder contained in one of the available data sections and select the required data source field in the Binding section of the invoked data item menu.
The table below lists and describes the Chart’s data sections.
Section | API | Processed as | Description |
|---|---|---|---|
Values | Contains data items against which the Y-coordinates of data points are calculated. The data item menu allows you to select the series type and specify different options. Some types of series accept several measures. To plot a series within the ChartItem, add the ChartSeries descendant to the ChartPane.series collection of a pane where you need to display this series. Use the ChartItem.panes property to access a desired pane. | ||
Arguments | Contains data items that provide values displayed along the X-axis of the chart. | ||
Series | Contains data items whose values are used to create chart series. |
Example
The following example shows how to create the Chart dashboard item, bind it to data and add to the existing dashboard.
Create data items (measures and dimensions) and use the DataItem.dataMember property to bind them to the existing data source’s columns. Then use the created measures and dimensions in the dashboard item to bind it to data.
After you add the created dashboard item to the Dashboard.items collection, call the Dashboard.rebuildLayout method to rebuild the dashboard layout and display changes.
// Use the line below for a modular approach:
// import * as Model from 'devexpress-dashboard/model'
// Use the line below for an approach with global namespaces:
// var Model = DevExpress.Dashboard.Model;

// ...
public createChartItem() {
    // Create data items for the Chart dashboard item.
    var chartCategoryName = new Model.Dimension();
    chartCategoryName.dataMember("CategoryName");
    var chartCountry = new Model.Dimension();
    chartCountry.dataMember("Country");
    var chartUnitPrice = new Model.Measure();
    chartUnitPrice.dataMember("UnitPrice");

    // Create the Chart dashboard item and bind it to data.
    var chartItem = new Model.ChartItem();
    chartItem.name('chart');
    chartItem.dataSource(sqlDataSource.componentName());
    chartItem.dataMember(sqlDataSource.queries()[0].name());

    chartItem.arguments.push(chartCategoryName);
    var pane = chartItem.panes()[0];
    var chartSeries = new Model.SimpleSeries(chartItem);
    chartSeries.seriesType("Bar");
    chartSeries.value(chartUnitPrice);
    pane.series.push(chartSeries);
    chartItem.seriesDimensions.push(chartCountry);

    control.dashboard().items.push(chartItem);
    // ...
    control.dashboard().rebuildLayout();
}