Drill Down
- 8 minutes to read
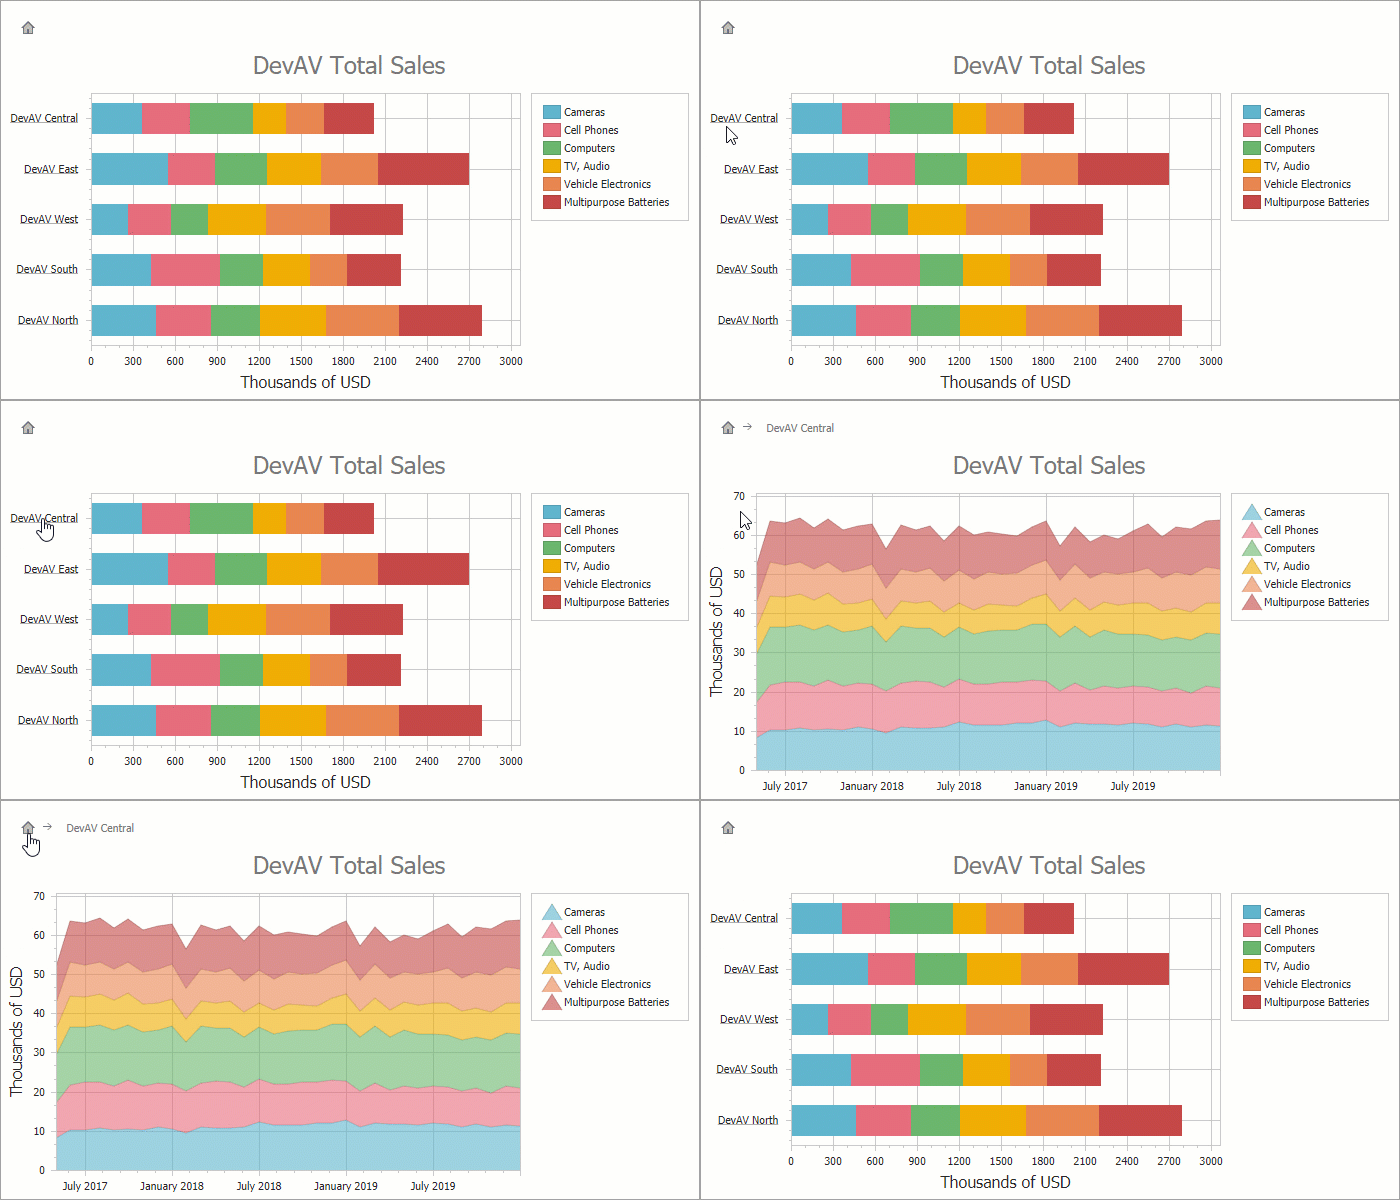
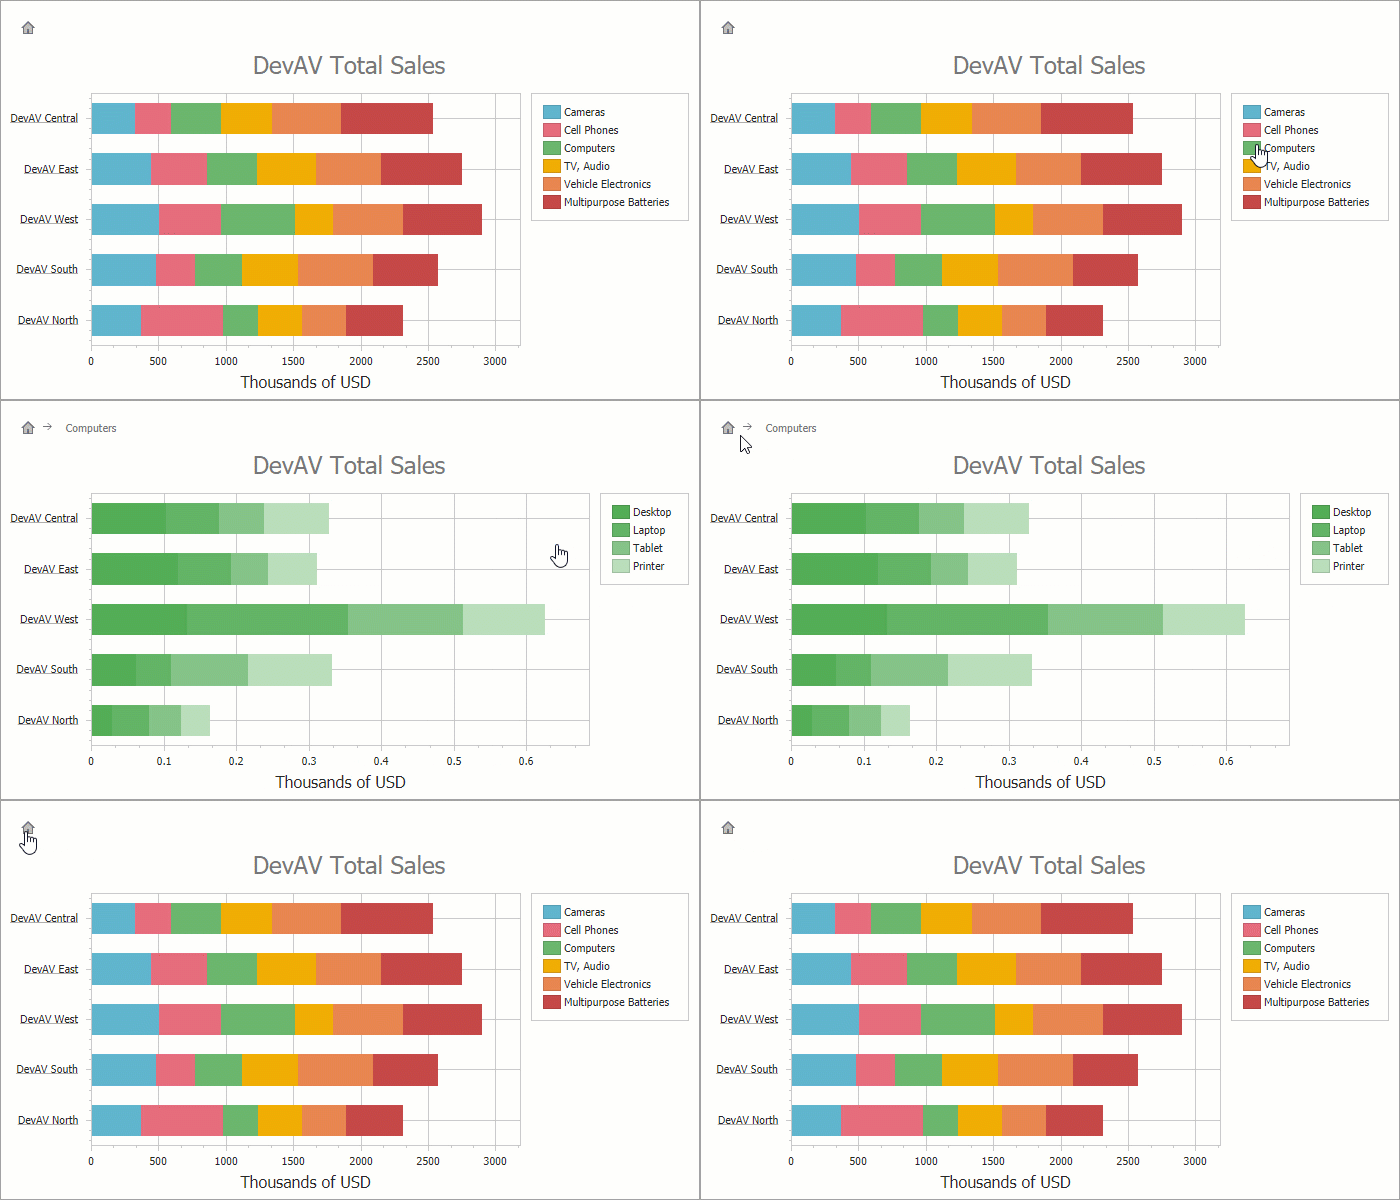
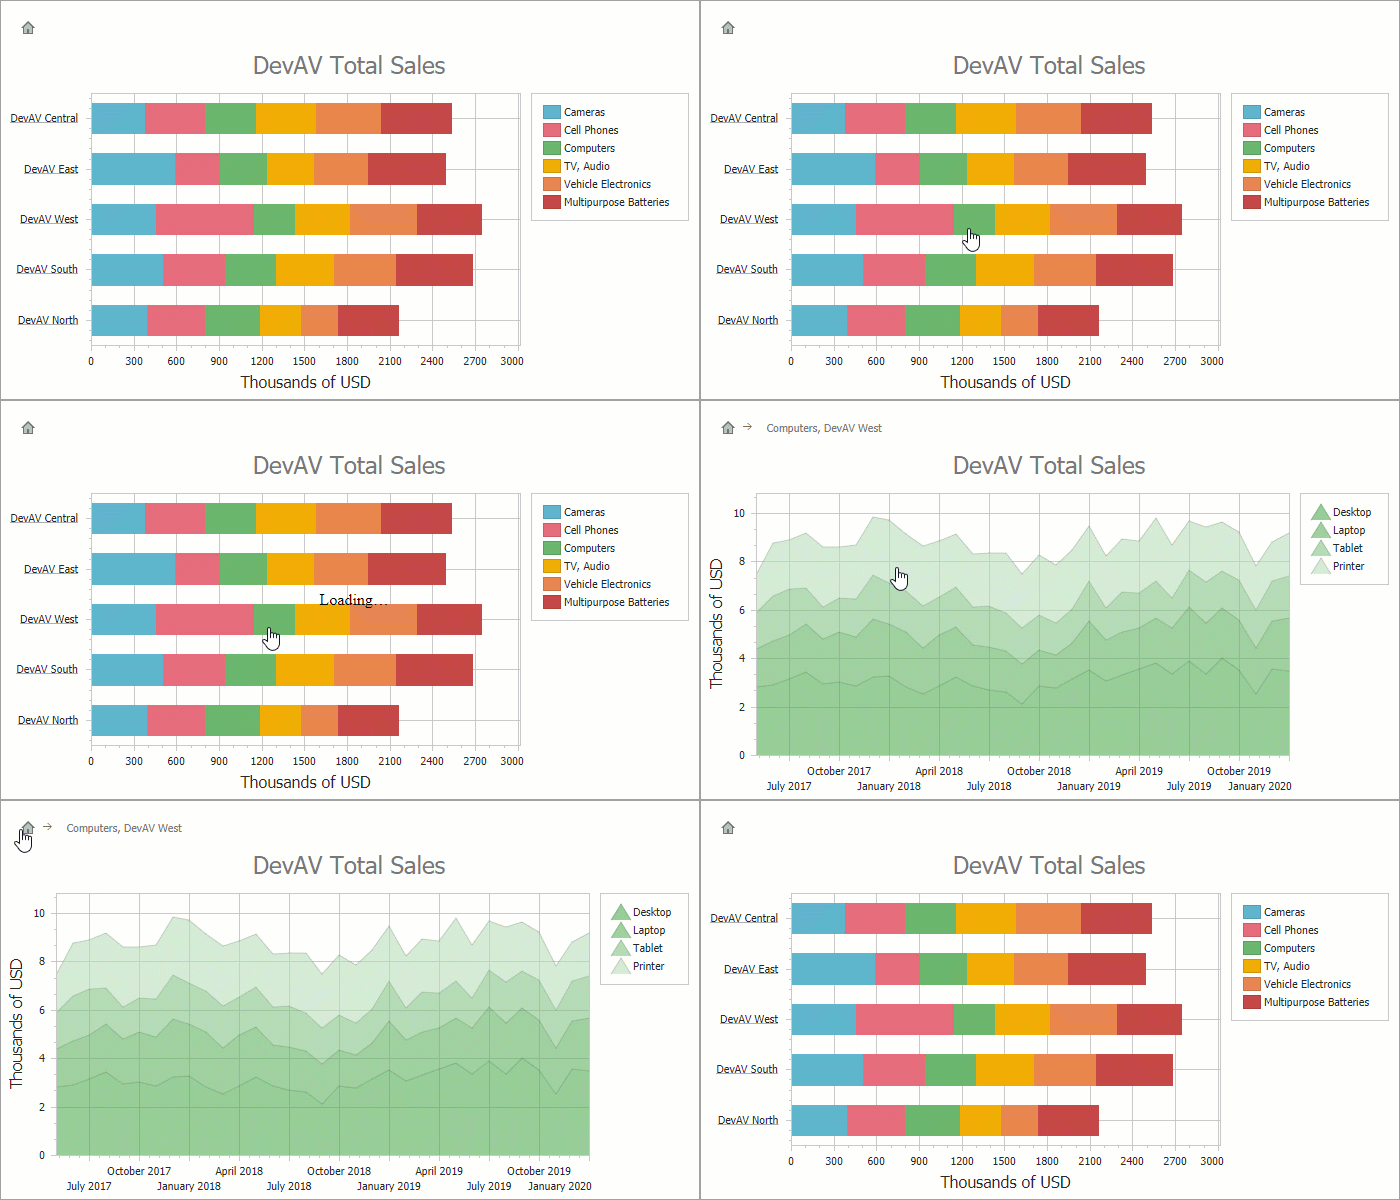
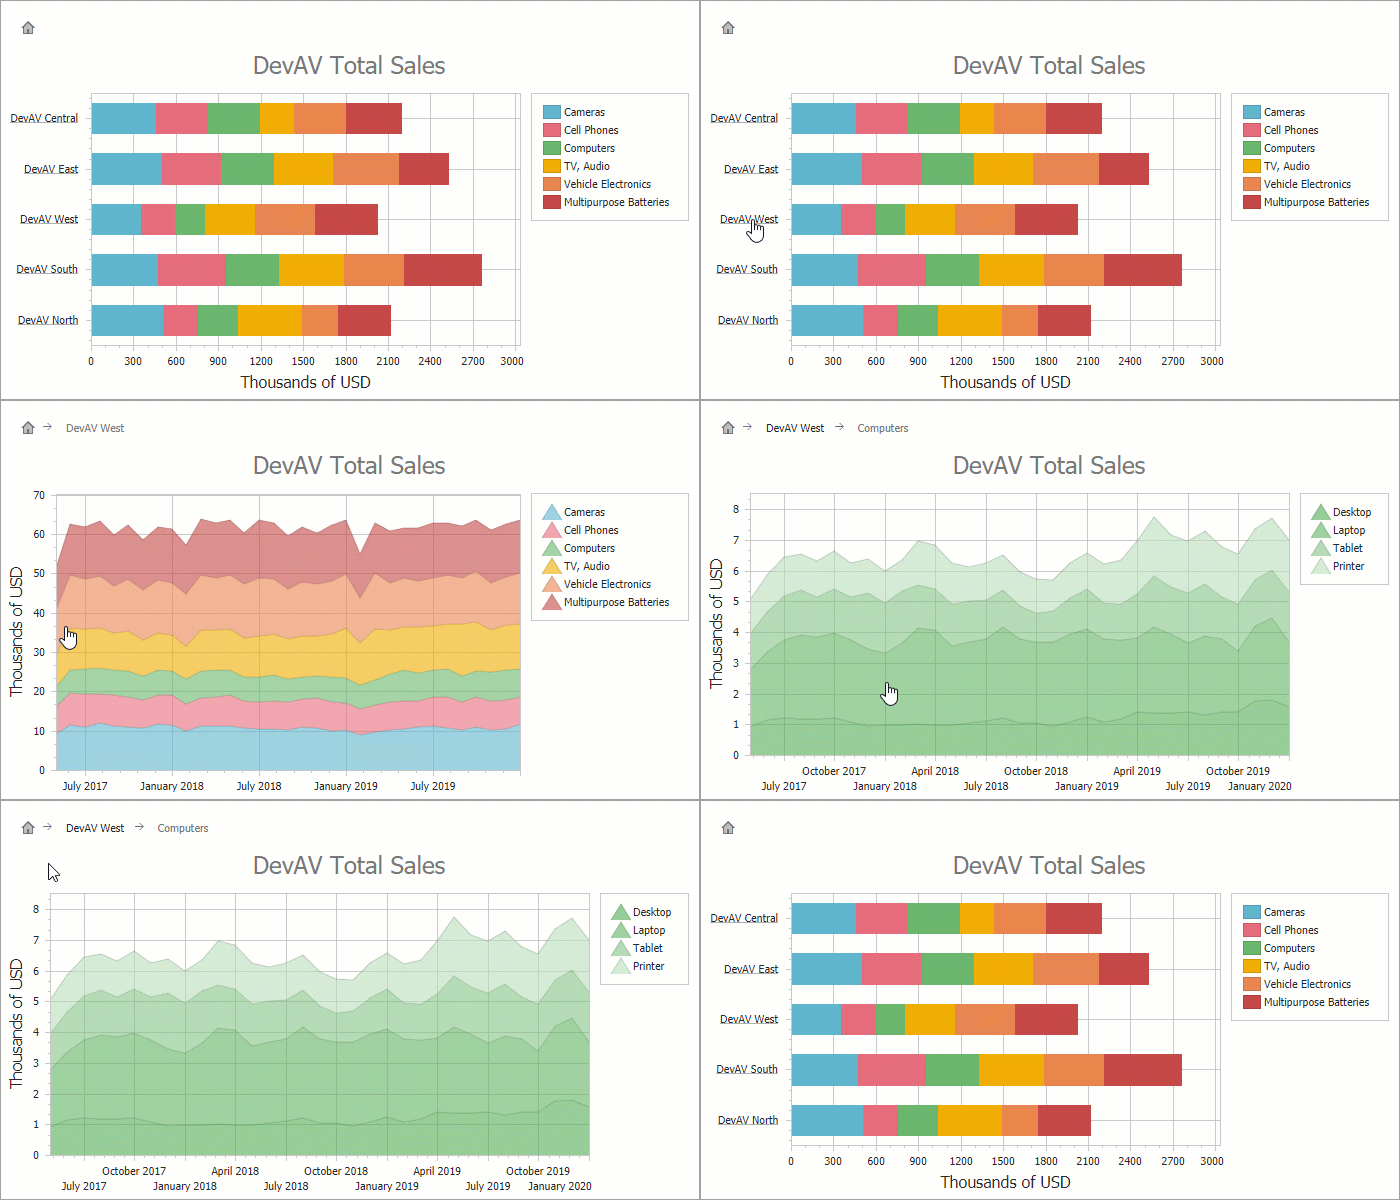
Users can drill down on a segment of a chart to view data at different hierarchy levels. They can, for example, click an axis argument, series point or series to change the detail level. The Chart Control also includes API so that you can change the detail level in code. Note that the Drill Down feature can only be used for series generated via series templates.

Demo: Drill Down
Configure the Drill-Down Chart
The Chart Control utilizes Nested Series Templates to display data at each level. Each series template can store up to three child templates that specify detail data visualization, and each child template can store three nested templates. All series templates use WebChartControl.DataSource (or DataSourceID), but detailed templates obtain filtered data. The following list enumerates all child template types and explains data received by a detailed template:
Note
- The argument field is the data member field whose name is the series template’s SeriesBase.ArgumentDataMember property value.
- The series field is the data member field whose name is the series template’s SeriesTemplate.SeriesDataMember property value.
Drill down on an Argument
The Chart applies the SeriesTemplate.ArgumentDrillTemplate to reveal detail data when a user clicks an argument axis label. Detail data contains all data items that include an argument field value that equals the clicked axis argument.

The following code demonstrates how to configure this template:
<dxui:WebChartControl ID="WebChartControl1" runat="server" Height="400px" Width="700px"
                    DataSourceID="chartDataSource"
                    ClientInstanceName="chart"
                    SeriesDataMember="ProductCategory">
    <SeriesTemplate ArgumentDataMember="Region" ValueDataMembersSerializable="Sales"
                    LabelsVisibility="False" CrosshairLabelPattern="{S}: ${V:N2}">
        <ViewSerializable>
            <dxc:StackedBarSeriesView/>
        </ViewSerializable>
        <QualitativeSummaryOptions SummaryFunction="SUM([Sales])"/>
        <ArgumentDrillTemplate SeriesDataMember="ProductCategory" ArgumentDataMember="SaleDate" ValueDataMembersSerializable="Sales"
                                CrosshairLabelPattern="{S}: ${V:N2}">
                <ViewSerializable>
                    <dxc:StackedAreaSeriesView Transparency="100"/>
                </ViewSerializable>
        </ArgumentDrillTemplate>
    </SeriesTemplate>
    ...
</dxui:WebChartControl>
The code snippet above uses the following properties:
| Symbol | Description |
|---|---|
| WebChartControl.SeriesTemplate | Returns the series template that configures automatically generated series. |
| SeriesTemplate.ArgumentDrillTemplate | Gets or sets the series template that the Chart Control uses to generate detailed series when the Control should display a data slice filtered by an argument. |
Drill down on a Series
The SeriesTemplate.SeriesDrillTemplate specifies how the Chart Control displays detail data when users click a continuous series (e.g., Lines or Areas) or a legend marker for a discrete series (e.g., Bars or Points). Detail data contains all data items that include a series field value equal to the selected series identifier.

The following code demonstrates how to configure this template:
<dxui:WebChartControl ID="WebChartControl1" runat="server" Height="400px" Width="700px"
                    DataSourceID="chartDataSource"
                    ClientInstanceName="chart"
                    ...
                    SeriesDataMember="ProductCategory">
    <SeriesTemplate ArgumentDataMember="Region" ValueDataMembersSerializable="Sales"
                    LabelsVisibility="False" CrosshairLabelPattern="{S}: ${V:N2}">
        <ViewSerializable>
            <dxc:StackedBarSeriesView/>
        </ViewSerializable>
        <QualitativeSummaryOptions SummaryFunction="SUM([Sales])"/>

        <SeriesDrillTemplate SeriesDataMember="ProductName" ArgumentDataMember="Region" ValueDataMembersSerializable="Sales"
                                CrosshairLabelPattern="{S}: ${V:N2}">
            <ViewSerializable>
                <dxc:StackedBarSeriesView/>
            </ViewSerializable>
            ...
        </SeriesDrillTemplate>
    </SeriesTemplate>
</dxui:WebChartControl>
The example uses the properties outlined below.
| Symbol | Description |
|---|---|
| WebChartControl.SeriesTemplate | Returns the series template that configures automatically generated series. |
| SeriesTemplate.SeriesDrillTemplate | Gets or sets the series template that the Chart Control uses to generate detailed series when the Control should display a data slice filtered by a series identifier. |
Drill down on a Series Point
The SeriesTemplate.SeriesPointDrillTemplate template specifies how series display detail data when a user selects a series point. Detail data contains data items that the Chart Control summarizes or aggregates in the selected series point.

The following code demonstrates how to configure this template:
<dxui:WebChartControl ID="WebChartControl1" runat="server" Height="400px" Width="700px"
                    DataSourceID="chartDataSource"
                    ClientInstanceName="chart"
                    ...
                    SeriesDataMember="ProductCategory">
    <SeriesTemplate ArgumentDataMember="Region" ValueDataMembersSerializable="Sales"
                    LabelsVisibility="False" CrosshairLabelPattern="{S}: ${V:N2}">
        <ViewSerializable>
            <dxc:StackedBarSeriesView/>
        </ViewSerializable>
        <QualitativeSummaryOptions SummaryFunction="SUM([Sales])"/>
        <SeriesPointDrillTemplate SeriesDataMember="ProductName" ArgumentDataMember="SaleDate" ValueDataMembersSerializable="Sales"
                                  CrosshairLabelPattern="{S}: ${V:N2}">
            <ViewSerializable>
                <dxc:StackedAreaSeriesView Transparency="100"/>
            </ViewSerializable>
        </SeriesPointDrillTemplate>
    </SeriesTemplate>
    ...
</dxui:WebChartControl>
The code snippet above uses the following properties:
| Symbol | Description |
|---|---|
| WebChartControl.SeriesTemplate | Returns the series template that configures automatically generated series. |
| SeriesTemplate.SeriesPointDrillTemplate | Gets or sets the series template that the Chart Control uses to generate detailed series when the Control should display a data slice filtered by a series point. |
Note
A user cannot drill down on a discrete series from a legend when the series’s ColorEach property is set to “true.
Create Nested Templates
Any ~DrillTemplate can contain nested templates to show detail data.

The following code demonstrates how to configure the chart control to display the second nested data level (in the code, an ArgumentDrillTemplate stores an embedded SeriesDrillTemplate):
<dx:WebChartControl ID="WebChartControl1" runat="server" Height="400px" Width="700px"
                    DataSourceID="chartDataSource"
                    ClientInstanceName="chart"
                    ...
                    SeriesDataMember="ProductCategory">
    <SeriesTemplate ArgumentDataMember="Region" ValueDataMembersSerializable="Sales"
                    LabelsVisibility="False" CrosshairLabelPattern="{S}: ${V:N2}">
        <ViewSerializable>
            <dx:StackedBarSeriesView/>
        </ViewSerializable>
        <QualitativeSummaryOptions SummaryFunction="SUM([Sales])"/>
        <ArgumentDrillTemplate SeriesDataMember="ProductCategory" ArgumentDataMember="SaleDate" ValueDataMembersSerializable="Sales"
                               CrosshairLabelPattern="{S}: ${V:N2}">
                <ViewSerializable>
                    <dx:StackedAreaSeriesView Transparency="100"/>
                </ViewSerializable>
            <SeriesDrillTemplate SeriesDataMember="ProductName" ArgumentDataMember="SaleDate" ValueDataMembersSerializable="Sales"
                                 CrosshairLabelPattern="{S}: ${V:N2}">
                <ViewSerializable>
                    <dx:StackedAreaSeriesView Transparency="100"/>
                </ViewSerializable>
            </SeriesDrillTemplate>
        </ArgumentDrillTemplate>
    </SeriesTemplate>
    ...
</dx:WebChartControl>
Handle And Prevent Drill Down State Change
The Chart Control includes the WebChartControl.DrillDownStateChanging event that allows you to check the data level and prevent the display of the detail level, and the WebChartControl.DrillDownStateChanged event that allows you to customize the chart’s diagram in relation to the current data level.
<dxui:WebChartControl ID="WebChartControl1" runat="server" Height="400px" Width="700px"
                      ...
                      OnDrillDownStateChanged="WebChartControl1_DrillDownStateChanged"
                      OnDrillDownStateChanging="WebChartControl1_DrillDownStateChanging">
                      ...
</dxui:WebChartControl>
protected void WebChartControl1_DrillDownStateChanged(object sender, DrillDownStateChangedEventArgs e) {
    XYDiagram diagram = WebChartControl1.Diagram as XYDiagram;
    if (diagram != null) {
        if (e.Series[0].View is StackedBarSeriesView) {
            diagram.Rotated = true;
            WebChartControl1.CrosshairOptions.ShowArgumentLine = false;
            WebChartControl1.CrosshairOptions.CrosshairLabelMode = CrosshairLabelMode.ShowForNearestSeries;
        }
        else {
            diagram.Rotated = false;
            WebChartControl1.CrosshairOptions.ShowArgumentLine = true;
            WebChartControl1.CrosshairOptions.CrosshairLabelMode = CrosshairLabelMode.ShowCommonForAllSeries;
        }
    }
}
protected void WebChartControl1_DrillDownStateChanging(object sender, DrillDownStateChangingEventArgs e) {
    if (e.States.Length != 0) {
        object categoryValue = null;
        if (e.States.Last().Parameters.TryGetValue("ProductCategory", out categoryValue)) {
            int seriesIndex = WebChartControl1.Series.IndexOf(WebChartControl1.Series[(string)categoryValue]);
            int colorIndex = seriesIndex % WebChartControl1.PaletteRepository[WebChartControl1.PaletteName].Count + 1;
            WebChartControl1.PaletteBaseColorNumber = colorIndex;
        }
        if (WebChartControl1.Diagram is XYDiagram diagram) {
            diagram.AxisX.Label.Font = new Font("Tahoma", 8.25f, FontStyle.Regular);
        }
    }
    else {
        WebChartControl1.PaletteBaseColorNumber = 0;
        if (WebChartControl1.Diagram is XYDiagram diagram) {
            diagram.AxisX.Label.Font = new Font("Tahoma", 8.25f, FontStyle.Underline);
        }
    }
}
The following table contains classes and members that allow you to manage changes to the drill down state:
| Symbol | Description |
|---|---|
| WebChartControl.DrillDownStateChanging | Occurs before the Web Chart Control’s drill down state is changed. |
| DrillDownStateChangingEventArgs | Provides data for the WebChartControl.DrillDownStateChanging event. |
| WebChartControl.DrillDownStateChanged | Occurs when the Web Chart Control’s drill down state is changed. |
| DrillDownStateChangedEventArgs | Provides data for the WebChartControl.DrillDownStateChanged event. |
Manage Drill Down State at Runtime
The chart control includes methods that allow you to drill down/drill up to a specific detail level.
WebChartControl.DrillUp - Drills up if the actual series template is not a root (WebChartControl.SeriesTemplate) template.
<dx:ASPxButton ID="ASPxButton1" runat="server" OnClick="ASPxButton1_Click" Text="Drill Up"/>WebChartControl.DrillDownToArgument - Drills down to the passed argument if the actual series template has the SeriesTemplate.ArgumentDrillTemplate specified.
<div> <dxui:WebChartControl ID="WebChartControl1" runat="server" DataSourceID="chartDataSource" ClientInstanceName="chart" ... SeriesDataMember="ProductCategory"> <SeriesTemplate ArgumentDataMember="Region" ValueDataMembersSerializable="Sales" LabelsVisibility="False" CrosshairLabelPattern="{S}: ${V:N2}"> <ViewSerializable> <dxc:StackedBarSeriesView/> </ViewSerializable> <QualitativeSummaryOptions SummaryFunction="SUM([Sales])"/> <ArgumentDrillTemplate SeriesDataMember="ProductCategory" ArgumentDataMember="SaleDate" ValueDataMembersSerializable="Sales" CrosshairLabelPattern="{S}: ${V:N2}"> <ViewSerializable> <dxc:StackedAreaSeriesView Transparency="100"/> </ViewSerializable> </ArgumentDrillTemplate> </SeriesTemplate> ... </dxui:WebChartControl> </div> <p> <dx:ASPxButton ID="ASPxButton2" runat="server" OnClick="ASPxButton2_Click" Text="Drill Down On Argument"/> </p>WebChartControl.DrillDownToSeries - Drills down to a series with the passed series ID if the actual series template has the SeriesTemplate.SeriesDrillTemplate specified.
<div> <dxui:WebChartControl ID="WebChartControl1" runat="server" DataSourceID="chartDataSource" ClientInstanceName="chart" ... SeriesDataMember="ProductCategory"> <SeriesTemplate ArgumentDataMember="Region" ValueDataMembersSerializable="Sales" LabelsVisibility="False" CrosshairLabelPattern="{S}: ${V:N2}"> <ViewSerializable> <dxc:StackedBarSeriesView/> </ViewSerializable> <QualitativeSummaryOptions SummaryFunction="SUM([Sales])"/> <SeriesDrillTemplate SeriesDataMember="ProductName" ArgumentDataMember="Region" ValueDataMembersSerializable="Sales" CrosshairLabelPattern="{S}: ${V:N2}"> <ViewSerializable> <dxc:StackedBarSeriesView/> </ViewSerializable> </SeriesDrillTemplate> </SeriesTemplate> ... </dxui:WebChartControl> </div> <p> <dx:ASPxButton ID="ASPxButton3" runat="server" OnClick="ASPxButton3_Click" Text="Drill Down On Series"/> </p>WebChartControl.DrillDownToSeriesPoint - Drills down to the passed series point if the actual series template has the SeriesTemplate.SeriesPointDrillTemplate specified.
<div>
    <dxui:WebChartControl ID="WebChartControl1" runat="server"
                            DataSourceID="chartDataSource"
                            ClientInstanceName="chart"
                            ...
                            SeriesDataMember="ProductCategory">
        <SeriesTemplate ArgumentDataMember="Region" ValueDataMembersSerializable="Sales"
                        LabelsVisibility="False" CrosshairLabelPattern="{S}: ${V:N2}">
            <ViewSerializable>
                <dxc:StackedBarSeriesView/>
            </ViewSerializable>
            <QualitativeSummaryOptions SummaryFunction="SUM([Sales])"/>
            <SeriesPointDrillTemplate SeriesDataMember="ProductName" ArgumentDataMember="SaleDate" ValueDataMembersSerializable="Sales"
                                        CrosshairLabelPattern="{S}: ${V:N2}">
                <ViewSerializable>
                    <dxc:StackedAreaSeriesView Transparency="100"/>
                </ViewSerializable>
            </SeriesPointDrillTemplate>
        </SeriesTemplate>
        ...
    </dxui:WebChartControl>
</div>
<p>
     <dx:ASPxButton ID="ASPxButton4" runat="server" OnClick="ASPxButton4_Click" Text="Drill Down On Series Point"/>
</p>
Important
The DrillDownTo… methods do not change the drill down state if:
- the actual series template does not specify a corresponding nested template;
- the data source does not contain a value passed as the method parameter for an argument field value, a series field value or a data object.