Chart Titles
- 3 minutes to read
This topic describes how to create and customize chart titles, and illustrates their general functionality.
Note
The Chart Control can hide its elements if there is insufficient space to display them. Elements are hidden in the following order:
- Legends
- Axis Titles
- Series Titles
- Pane Titles
- Axes
- Chart Title
- Breadcrumbs
To make the Chart Control always display its elements, disable the WebChartControl.AutoLayout property.
Overview
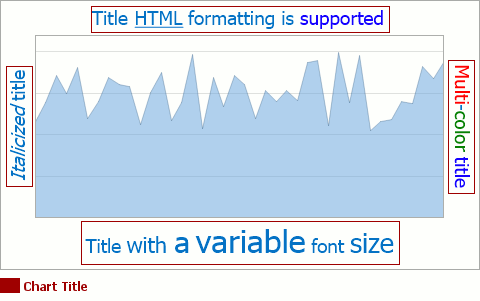
Chart titles are used to add text headers and explanations to a chart. You can display an unlimited number of titles within a single chart.
Note
If a chart title’s length exceeds the chart size, you can use the AlignedTitle.WordWrap property to force the title’s text to be wrapped in multiple lines.
In addition, chart titles support HTML tags. This allows you to use standard HTML tags to format chart titles.
Refer to the following help topic to learn more about HTML support: HTML Text Formatting.
The section below describes how to create chart titles at design time.
Creation
Follow the steps below to access a chart’s title collection at design time.
- Select the chart control, and in the Properties window, locate the WebChartControl.Titles property.
Click the title’s ellipsis button.

The Chart Title Collection Editor is displayed.

In this dialog, use the Add button to create chart titles.
After a title is created, you can customize its appearance and behavior.
Customization
Use the following properties to customize a chart title.
- The Title.Text property specifies the title’s text. You can format a chart’s title with standard HTML tags. To see a list of HTML tags, refer to the following help topic: HTML Text Formatting.
- The TitleBase.Font, TitleBase.EnableAntialiasing and TitleBase.TextColor properties are used to customize the appearance of the title text. Note that the color defined by a title’s HTML <color> tags have priority over the title’s TitleBase.TextColor property setting.
- The AlignedTitle.Alignment and DockableTitle.Dock properties determine the position of a title within a chart.
- The DockableTitle.Indent property defines the space around a title (in pixels).
The AlignedTitle.WordWrap property enables automatic word wrap for lengthy chart titles.
After you enable the word wrap feature, the AlignedTitle.MaxLineCount property comes into effect. This property allows you to limit the number of lines that are displayed when a title’s text is wrapped. Note that lines that exceed this limit are cut off by an ellipsis.

If required, you can increase the AlignedTitle.MaxLineCount property value so that the entire text will fit. However, if the number of lines is increased, the chart’s diagram size will decrease as a result.

You can disable the TitleBase.Visible property to hide a title without removing it from the collection.