Series Points
- 3 minutes to read
This topic describes the general concepts of series data points. For a detailed tutorial, refer to the following help topic: Manually Add Points to a Series.
A series point is a visual element that uses an argument and value in a chart’s diagram as the X and Y coordinates - to depict an individual data source point. To learn more about a data point’s argument and value, refer to the following help topic: Understanding a Data Point, Its Argument and Its Value.
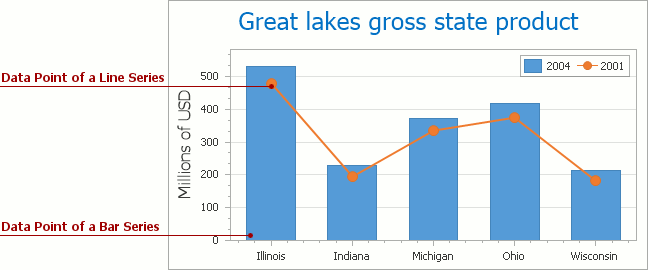
A series point’s appearance and visual settings depend on the view type of the series. The following image demonstrates a series point implementation for two series of different view types.
To be displayed in a chart, a series requires at least one data point, with at least one argument and one or more values defined. The scale type should match the argument and value data members. Three scale types are available: the numeric and date-time scale types - applicable both to point values and arguments, and the special qualitative type - for arguments only. Each scale type has its own requirements and a specific functionality. To learn more, refer to the following help topic: Series Scale Types.
Note
The sequence in which series points are drawn corresponds to their order in the collection. Data bound series, however, may expose a more complex drawing sequence (especially when complicated data bindings are involved, events such as WebChartControl.BoundDataChanged are handled, or the qualitative scale type is used). If series points must be drawn in a specific sequence, you can add a static series with points arranged as required, and set this series as the first item in the collection.
Series points can be created and populated either manually (added to the collection returned by the Series.Points property), or automatically (based on a predefined template that obtains data from the chart’s data source and configures series appearance settings). For details on how to bind to data, refer to the following help topic: Binding to Data.
Series points can be accompanied with textual labels and annotations.
Typically, a chart’s legend refers to the chart’s series. However, it is possible to display series points in the legend as well. As with series point labels, you can show a point’s arguments, values, or both. Refer to the following help topic for more information: Legend Overview.
Typically, series points are automatically sorted by their arguments. This means that series points are not displayed in the order in which they appear in the collection. Series points are sorted (in ascending order, by default) based on the series argument scale type, so that points with equal arguments are aggregated under the same value on the X-axis. The only exception is the Scatter Line series view type. In this view type, points are inter-connected by lines based on their order in the series point collection.