Choose a Palette for Painting Series, Points and Indicators
- 2 minutes to read
This topic describes how to select a palette to paint a chart’s series (or their individual points). The same steps will also define an individual palette to paint a chart’s indicators.
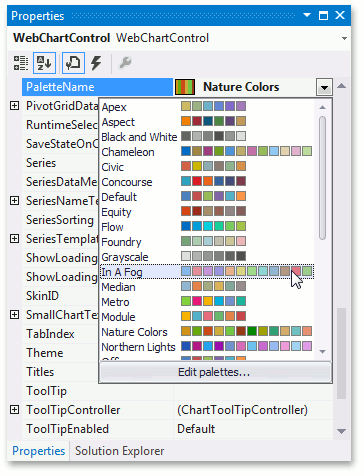
You can use the WebChartControl.PaletteName property to choose a predefined palette to paint a chart’s series or series points.
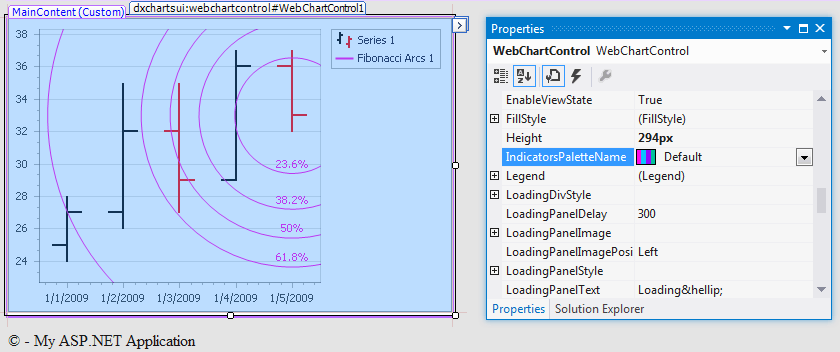
To define a similar palette for all chart indicators, use the WebChartControl.IndicatorsPaletteName property.
The following images demonstrate the same chart with different palettes (the Default appearance is used). For the complete list of predefined palettes, see the following help topic: PaletteRepository.PaletteNames.
| PaletteName = Concourse | PaletteName = Apex | PaletteName = Grayscale |
|---|---|---|
 |
 |
 |
Additionally, within the selected palette, you can specify the base color of this palette, to assign a spectrum based on this color. The base color is specified by an integer value of the WebChartControl.PaletteBaseColorNumber property. Its effect is demonstrated in the following image. The Concourse palette is used in this example.
| PaletteBaseColorNumber = 1 | PaletteBaseColorNumber = 3 |
|---|---|
 |
 |
When the WebChartControl.PaletteBaseColorNumber property is set to 0 and the SeriesViewColorEachSupportBase.ColorEach property of a series is set to true, the palette is used to paint the individual points of that series.
When a palette base color number is not equal to 0, the SeriesViewColorEachSupportBase.ColorEach property paints series points based on a composition of the specified color.
ColorEach = true PaletteBaseColorNumber = 0 | ColorEach = true PaletteBaseColorNumber = 1 |
|---|---|
|
|


If none of these solutions produce the desired result, you have the option to create a custom palette.