v25.2 Release Notes
- 16 minutes to read
Tip
Visit our website to explore new features/capabilities available across the entire DevExpress product line: What’s New in Our Latest Update.
.NET 10 & Visual Studio 2026 Support
DevExpress Reports now supports .NET 10 and Visual Studio 2026.
Design Reports in JetBrains Rider
DevExpress Reports now offer full design-time integration with JetBrains Rider for .NET Framework projects (ASP.NET Web Forms & MVC, WinForms, and WPF). You can use the built-in DevExpress Report Designer to configure data bindings, build and customize layouts, and preview reports without leaving the IDE.

Features include:
- Create new reports and modify existing reports.
- Fully customizable design surface with drag & drop support.
- Preview reports directly in an integrated Report Preview.
- Create and configure data sources using the Data Source Wizard.
Please note that support for .NET projects is planned for early 2026 (likely in a minor update of v25.2).
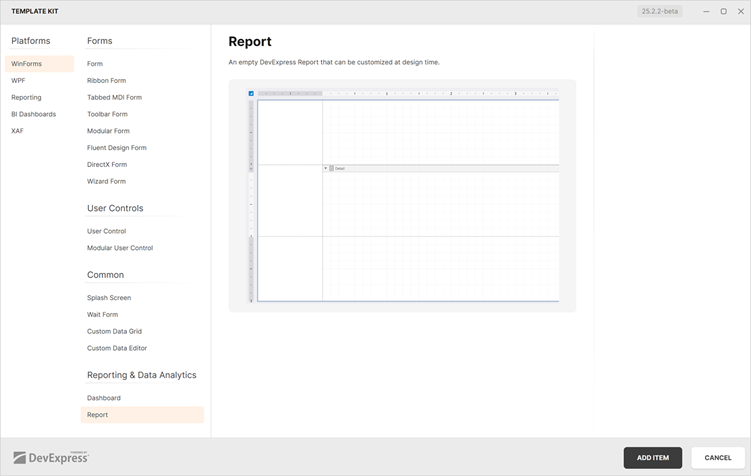
Template Kit — New Project and Item Templates for WinForms
DevExpress Template Kit v25.2 includes the following templates for WinForms-based projects:
- Report Viewer Application (Project Template)
CLI command[1] :
dx.win.reportingCreates a desktop (WinForms) application with a Report Viewer (displays a pre-built tabular report).

- Report (Item Template)
CLI command:
dx.win.reportitemAdds a new DevExpress Report to a WinForms project.
DevExpress Documentation MCP Server
DevExpress Template Kit project templates now include optional MCP server configuration support for Visual Studio and VS Code.
Accessibility Enhancements
PDF Export
The XRAccessibleRole enumeration includes the following new values:
DecorativeFigureParagraph
Elements marked as Decorative are treated as artifacts and excluded from the logical structure of exported PDF documents. Such elements do not appear in the tag tree, are ignored by assistive technologies, and are considered external to main content.
Use Figure and Paragraph values for report watermarks meant to convey meaningful information and to be announced by assistive technologies.
Mark Report Controls as Artifacts
Assistive software treats XRPictureBox, XRShape, XRBarCode, and XRZipCode controls in PDF documents as figures (<Figure>). Use the AccessibleRole property to mark these UI elements as artifacts and exclude them from the logical structure of exported PDF documents:
xrShape1.AccessibleRole = XRAccessibleRole.Decorative;
Add Alternative Text to Report Watermarks
Use the following properties to specify whether to include report watermarks in the logical structure of exported PDF documents:
- For image watermarks that convey meaningful information, set the
ImageAccessibleRoleproperty toXRAccessibleRole.Figureand use the XRWatermark.ImageAccessibleDescription property to specify alternative text. - For text watermarks, set the
TextAccessibleRoleproperty toXRAccessibleRole.Paragraphand use the XRWatermark.TextAccessibleDescription property to specify alternative text.
For purely decorative watermarks, retain the default value to treat the watermark as an artifact.
Automatic Table of Contents (TOC) Tagging
Exporting a report to a tagged PDF (PDF/UA-compliant) automatically converts the table of contents into <TOCI> tags. Screen readers and accessibility tools use these tags to interpret the document structure.
Report Design Analyzer — Validate Documents for Accessibility Compliance
The Report Design Analyzer now validates layout, document generation, and export settings for accessibility compliance across all supported platforms.
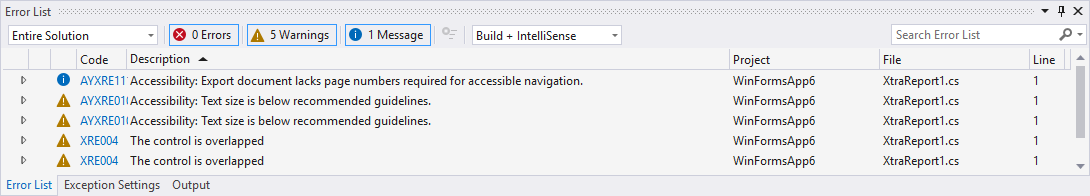
To enable accessibility validation in the Report Designer for Visual Studio, set the Enable Accessibility Validation option to true to include accessibility-related messages within the displayed message categories in the Error List:

Accessibility messages are added to the appropriate message category depending on their type: Error, Warning, or Information.
For End-User Report Designers, click the Accessibility bar item in the UI panel to display accessibility-related messages in the Report Design Analyzer.

We introduced multiple accessibility issues with error codes starting with the AY prefix to cover the main accessibility issues that arise when creating or exporting a report.
Review the following help topic for the complete error list: Errors, Warnings, and Information Messages.
DateOnly & TimeOnly Support — Time-Range Parameter Editors
DevExpress Report Viewers for Web, WPF, and Blazor now support TimeOnly range parameters. Users can filter reports against time intervals independent of specific dates.
The following code snippet creates and adds DateOnly and TimeOnly range parameters to a report:
var report = new XtraReport();
// ...
// Add the start interval value.
var p1start = new RangeStartParameter() {
    Type = typeof(DateOnly),
    Value = DateOnly.FromDateTime(DateTime.Today).AddDays(-7),
};

// Add the end interval value.
var p1end = new RangeEndParameter() {
    Type = typeof(DateOnly),
    Value = DateOnly.FromDateTime(DateTime.Today),
};

// Add the range parameter.
var p1 = new Parameter() {
    Type = typeof(DateOnly),
    Value = DateOnly.FromDateTime(DateTime.Today),
    ValueSourceSettings = new RangeParametersSettings(p1start, p1end)
};

report.Parameters.Add(p1);

// Add the start interval value.
var p2start = new RangeStartParameter() {
    Type = typeof(TimeOnly),
    Value = TimeOnly.FromTimeSpan(TimeSpan.FromMinutes(10)),
};

// Add the end interval value.
var p2end = new RangeEndParameter() {
    Type = typeof(TimeOnly),
    Value = TimeOnly.FromTimeSpan(TimeSpan.FromMinutes(30)),
};

// Add the range parameter.
var p2 = new Parameter() {
    Type = typeof(TimeOnly),
    Value = TimeOnly.FromDateTime(DateTime.Today),
    ValueSourceSettings = new RangeParametersSettings(p2start, p2end)
};

report.Parameters.Add(p2);
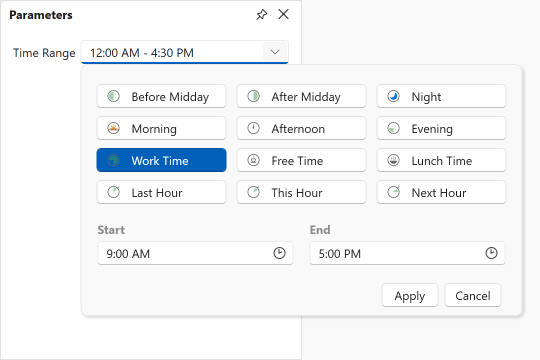
Our Time Range Parameter Editor supports predefined range customization.
Use the RangeParameterEditorOptions class to programmatically add or modify custom range values within your DevExpress-powered WinForms and WPF applications:
RangeParameterEditorOptions.PredefinedTimeRanges.Remove("Lunch Time");
RangeParameterEditorOptions.RegisterTimeRange("CustomTimeInterval", () => new TimeOnly(10, 30, 00), () => new TimeOnly(11, 30, 0));
Review the following help topics for additional information (customize predefined range values in a web application):
- Blazor Report Viewer - Customize Predefined Time Ranges
- Web Report Viewer - Customize Predefined Time Ranges
AI-powered Report Extensions — Enhancements
Optimized Token Consumption for AI Report Operations
We improved system prompts and AI tools used when generating/modifying reports (to help optimize token consumption).
System Prompt Augmentation — Custom Context
DevExpress AI-powered Report Extensions now support system prompt augmentation with custom context. For example, you can supply industry-specific terminology to the AI-powered localization extension to ensure correct word usage, exclude specific report items from translation, and specify the source language.
AI-powered Visual Studio Report Designer
AI-powered features in the Visual Studio Designer require the DevExpress AI-powered Assistant extension, which is included in the DevExpress Unified Component Installer.
Before using AI-powered features, connect the DevExpress AI Assistant to Azure OpenAI or OpenAI service and configure required settings.
Go to Tools → Options → DevExpress → AI Assistant to open AI Assistant options:

AI-powered Localization
AI-powered Report Localization allows you to translate report elements into a target language directly within the Visual Studio Report Designer.
Our Localization Editor displays a Localize with AI button and automatically collects all static strings within a report and sends them to the AI service of choice for translation.

Preview Reports with AI-generated Test Data
You can generate AI-powered test data to preview reports without connecting to a live data source directly within the Visual Studio Report Designer. This will be of value if you design a report and wish to quickly check recent changes without access to a real data source. It also allows report creators to share report documents without including actual data.
Click the Test Data tab to preview a report with AI-generated test data. Our Report Designer requests data from an LLM and populates the report with meaningful values for preview.

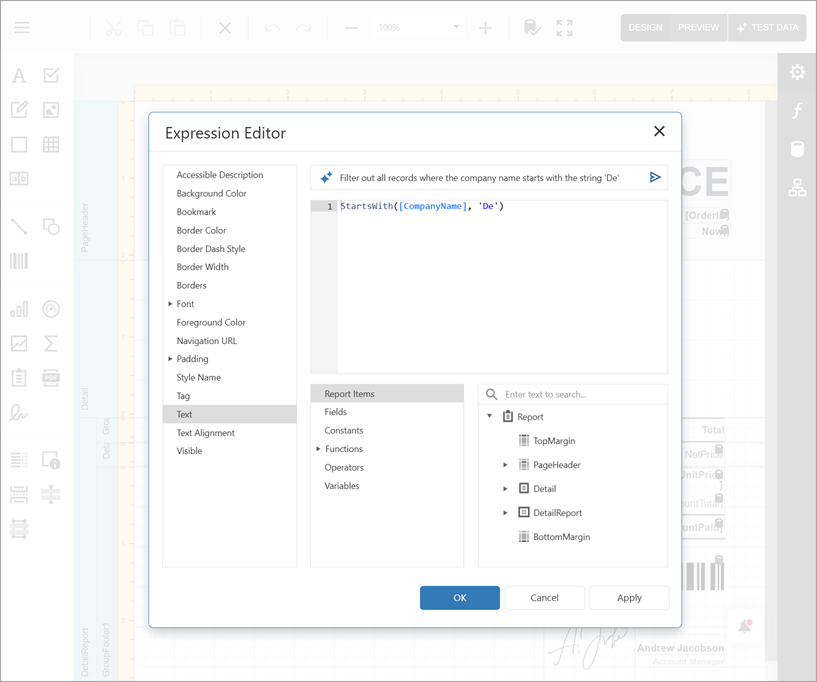
Create Expressions with Natural Language
The Visual Studio Report Designer allows you to generate Criteria Language expressions with AI assistance, within both the DevExpress Expression Editor and Filter String Editor. Instead of writing complex expressions, users can describe the desired logic in plain text.

Create AI-powered Reports Using Report Wizard
You can leverage AI to create report layouts based on natural language prompts directly within the Visual Studio Report Designer.
Add a DevExpress Report item to your project or open the Report Wizard for an existing report using the report’s smart tag menu. In the Report Wizard, select AI Prompt-to-Report and follow on-screen instructions.

In the Enter Report Description step, enter a prompt or choose a predefined prompt and modify it as needed. Once complete click Finish.

AI-powered Web Report Designer (Blazor & ASP.NET Core)
Create Expressions with Natural Language
Our Web AI-powered Expression Editor features a redesigned interface optimized for both WinForms and WPF platforms. Expression generation uses a unified implementation across all supported platforms.
AI-powered Report Designer for WPF
Create AI-powered Reports Using Report Wizard
Our WPF Report Wizard can leverage AI to generate reports from text descriptions. To activate this feature in a DevExpress AI-powered WPF application, use ReportPromptToReportBehavior:
xmlns:dxrud="http://schemas.devexpress.com/winfx/2008/xaml/reports/userdesigner"
xmlns:dxai="http://schemas.devexpress.com/winfx/2008/xaml/ai"
xmlns:dxmvvm="http://schemas.devexpress.com/winfx/2008/xaml/mvvm"
...
<dxrud:ReportDesigner x:Name="designer">
    <dxmvvm:Interaction.Behaviors>
        <dxai:ReportPromptToReportBehavior/>
    </dxmvvm:Interaction.Behaviors>
</dxrud:ReportDesigner>
Once activated, the Report Wizard displays a new AI Prompt-to-Report option:

AI-powered report generation supports two data source modes:
- No Data Source
- Creates a complete report structure based on a user’s natural language description.
- Add Data Source
- Creates and configures a report data source. The Report Wizard displays the data source structure and automatically includes this metadata in the LLM prompt. Users can reference available data source fields as they create data-bound report elements.

Our Report Wizard interface includes a prompt input area with placeholder text that guides users with detailed instructions. The quality of AI-generated output depends on the specificity of the natural language description. Include information such as layout preferences, calculations, grouping requirements, and visualization types to achieve the best result.
Like other LLM implementations, the system has limitations and may need modification to address precise requirements. For convenience, the Report Wizard displays built-in prompt suggestions that you can modify or extend.

Configure Predefined Prompts
You can customize predefined prompts through APIs to align AI-generated output with specific domain requirements or internal reporting standards.
Create a custom prompt (AIReportPrompt) and add it to the ReportPromptToReportBehavior.PredefinedPrompts collection:
xmlns:dxrud="http://schemas.devexpress.com/winfx/2008/xaml/reports/userdesigner"
xmlns:dxai="http://schemas.devexpress.com/winfx/2008/xaml/ai"
xmlns:dxmvvm="http://schemas.devexpress.com/winfx/2008/xaml/mvvm"
xmlns:reporting="clr-namespace:DevExpress.AIIntegration.Reporting;assembly=DevExpress.AIIntegration.Reporting.Common.v25.2"
...
<dxrud:ReportDesigner x:Name="designer">
    <dxmvvm:Interaction.Behaviors>
        <dxai:ReportPromptToReportBehavior.PredefinedPrompts>
            <reporting:AIReportPrompt Title="Custom Title" Text="prompt text" />
        </dxai:ReportPromptToReportBehavior.PredefinedPrompts>
        </dxai:ReportPromptToReportBehavior>
    </dxmvvm:Interaction.Behaviors>
</dxrud:ReportDesigner>
Modify Report Generation Process
Use the following ReportPromptToReportBehavior properties to configure AI-powered report generation:
| Property Name | Description |
|---|---|
| FixLayoutErrors | When enabled, AI automatically attempts to correct layout issues (for example, misaligned controls or overlapping elements) in the generated report. |
| RetryAttemptCount | Specifies the number of times AI should retry report generation if the initial attempt fails. |
| Temperature | Controls randomness in AI output and produces more deterministic results. Higher values increase variation. |
| PromptAugmentation | Specifies additional instructions that modify the prompt before processing. |
Note
Enabling these properties may introduce time delays during processing.
Preview Reports with AI-generated Test Data
Users can generate AI-powered test data to preview reports without connecting to a live data source directly within the WPF Report Designer.
To activate AI-generated Test Data in the WPF Report Designer, create a ReportTestDataSourceBehavior and configure its RowCount and Temperature settings:
xmlns:dxrud="http://schemas.devexpress.com/winfx/2008/xaml/reports/userdesigner"
xmlns:dxmvvm="http://schemas.devexpress.com/winfx/2008/xaml/mvvm"
xmlns:dxai="http://schemas.devexpress.com/winfx/2008/xaml/ai"
...
<dxrud:ReportDesigner x:Name="reportDesigner" Height="NaN" Width="NaN">
    <dxmvvm:Interaction.Behaviors>
        <dxai:ReportTestDataSourceBehavior x:Name="testDataSourceBehavior" RowCount="10" Temperature="0"/>
    </dxmvvm:Interaction.Behaviors>
</dxrud:ReportDesigner>
Once AI-generated Test Data is activated, the Report Designer displays a Test Data tab. Click it to preview the report with AI-generated test data. The Report Designer requests data from an LLM and populates the report with meaningful values for preview.

AI-powered Report Localization
Users can leverage AI to create localized reports within the WPF Report Designer.

Attach the ReportLocalizationBehavior to the WPF Report Designer to leverage AI-powered localization:
xmlns:dx="http://schemas.devexpress.com/winfx/2008/xaml/core"
xmlns:dxrud="http://schemas.devexpress.com/winfx/2008/xaml/reports/userdesigner"
xmlns:dxmvvm="http://schemas.devexpress.com/winfx/2008/xaml/mvvm"
xmlns:dxai="http://schemas.devexpress.com/winfx/2008/xaml/ai"

<dxrud:ReportDesigner x:Name="reportDesigner">
    <dxmvvm:Interaction.Behaviors>
        <dxai:ReportLocalizationBehavior/>
    </dxmvvm:Interaction.Behaviors>
</dxrud:ReportDesigner>
AI-powered Document Viewer for WPF
AI-powered Inline Report Translation
WPF Document Preview includes a new Translate Inline command in the AI context menu. Unlike the Translate command, Translate Inline translates report content directly within the preview and prints/exports the translated document (displaying a notification about AI-generated content before processing).

To activate Translate Inline in your DevExpress-powered WPF application, add the highlighted code to your XAML markup:
xmlns:dxp="http://schemas.devexpress.com/winfx/2008/xaml/printing"
xmlns:dxai="http://schemas.devexpress.com/winfx/2008/xaml/ai"
xmlns:dxmvvm="http://schemas.devexpress.com/winfx/2008/xaml/mvvm"
...
<dxp:DocumentPreviewControl Name="preview">
    <dxmvvm:Interaction.Behaviors>
        <dxai:DocumentTranslateInlineBehavior>
                <dxai:LanguageInfo Culture="de-DE"/>
                <dxai:LanguageInfo Culture="pt-BR"/>
        </dxai:DocumentTranslateInlineBehavior>
    </dxmvvm:Interaction.Behaviors>
</dxp:DocumentPreviewControl>
AI-powered Report Designer for WinForms
Preview Reports with AI-generated Test Data
Users can generate AI-powered Test Data to preview reports without connecting to a live data source directly within the WinForms Report Designer. Once AI-generated Test Data is activated, the Report Designer displays a Test Data tab. Click it to preview the report with AI-generated test data.

Follow the steps below to attach a Report Test Data Source Behavior to the WinForms Report Designer at design time:
- Drop the BehaviorManager component from the Toolbox onto a Form with the WinForms Report Designer.
- Invoke the
BehaviorManager‘s smart tag menu and click Edit Behaviors to open the Behavior Collection Editor. Add a Report Test Data Source Behavior and specify its
RowCountandTemperaturesettings.Setting Description RowCountSpecifies the number of rows/records the AI service generates for the test data source. TemperatureControls randomness in AI output and produces more deterministic results. Higher values increase variation.
Create Expressions with Natural Language
The WinForms Report Designer allows users to generate Criteria Language expressions with AI assistance, within both the DevExpress Expression Editor and Filter String Editor. Instead of writing complex expressions, users describe the desired logic in plain text.

Reporting for Blazor
Report Viewer — New Events
The DevExpress Blazor Report Viewer includes additional events designed to extend functionality and give you greater control over user interactions.
| Event | Description |
|---|---|
| OnPreviewClick | Occurs when a user clicks a report document. |
| OnPreviewDoubleClick | Occurs when a user double-clicks a report document. |
| OnReportOpened | Occurs when a report is loaded in the Report Viewer. |
Click events can help identify the clicked report element and execute custom actions (such as handling URL navigation, retrieving clicked row data to generate a separate report, canceling a drill-through operation, or displaying a custom popup).
The following code snippet handles the OnPreviewClick event and displays the text associated with the clicked “brick”. It also suppresses the default action for the Label 2 brick:
@using DevExpress.Blazor.Reporting
@using DevExpress.Blazor.Reporting.Models
@using DevExpress.XtraReports.UI

<div>Clicked: @Clicked</div>

<DxReportViewer @ref="viewer"
                Report="Report"
                OnPreviewClick="OnPreviewClick"
                OnReportOpened="OnReportOpened" />

@code {
    private DxReportViewer? viewer;
    private XtraReport Report = new TestReport();
    private string? Clicked;

    private Task OnPreviewClick(PreviewClickEventArgs e)
    {
        if (e.Brick is null) {
            Clicked = "Empty area";
            return Task.CompletedTask;
        }

        // Suppresses the default action for "Label 2".
        if (e.Brick.Text == "Label 2") {
            e.Handled = true;
        }
        Clicked = e.Brick.Text;
        return Task.CompletedTask;
    }
}
Handle the OnReportOpened event to activate a specific tab in the Report Viewer’s tab panel. The following code snippet activates the Parameter Panel tab when a report is opened (the report’s RequestParameters property is set to false):
private void OnReportOpened(ReportOpenedEventArgs args) {
    reportViewer.TabPanelModel.ActivateTab(TabId.Parameters);
}
Report Viewer — ‘Select All’ for Multi-Value Parameters
The Multi-Value Parameter Editor in the Blazor Report Viewer now includes a Select All option and updated UI/UX:

Reporting for Web — Web Report Designer
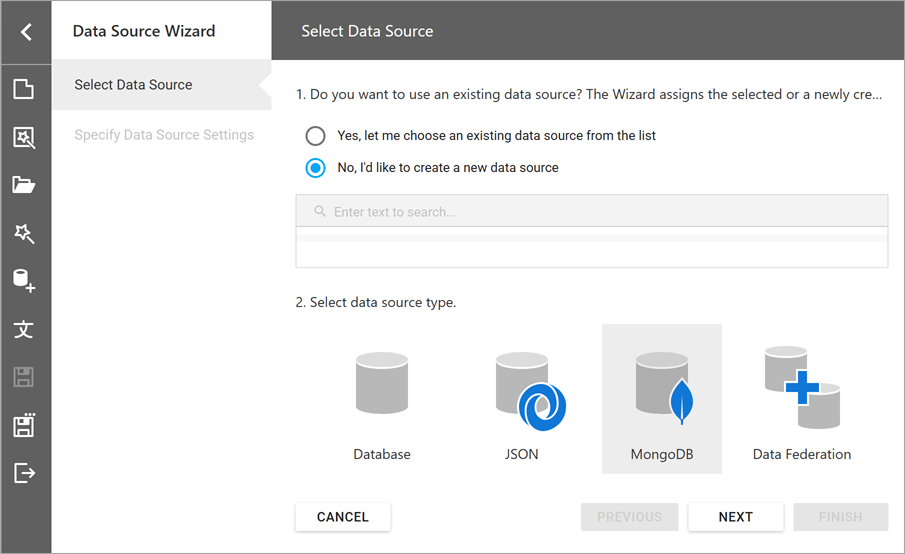
MongoDb Data Source Wizard and API to Register Predefined Connections
The DevExpress Web Report Designer allows users to connect to MongoDB data sources. To display the MongoDB option in the Data Source Wizard, you must:
- Install the MongoDB.Driver NuGet package.
Register a built-in MongoDB connection string provider or create a custom provider. See the following platform-specific help topics for instructions:
The MongoDB option appears in the Select Data Source page of the Data Source Wizard:
New Time Zone Conversion Expression Functions
v25.2 introduces built-in expression functions designed to convert UTC date/time values to/from the users’s local time zone. Users in different regions can view and analyze report data in their own time zones.
Use the following expression functions to integrate this functionality:
| Expression Function | Description |
|---|---|
UtcToLocalTime(datetime) |
Converts a UTC date-time value to the local time zone. |
LocalTimeToUtc(datetime) |
Converts a local date-time value to UTC. |
To specify the local time zone for date values displayed in reports, implement the ITimeZoneProvider interface and register it in the application’s service collection.
The following code snippet registers the CustomTimeZoneProvider service in an ASP.NET Core application and obtains the time zone identifier from the timezone browser cookie:
//Services/CustomTimeZoneProvider.cs

using System;
using DevExpress.XtraReports.Services;
using Microsoft.AspNetCore.Http;

namespace MyReportingApplication.Services {
    public class CustomTimeZoneProvider : ITimeZoneProvider {
        private readonly string timeZoneId;

        public CustomTimeZoneProvider(IHttpContextAccessor httpContextAccessor) {
            timeZoneId = httpContextAccessor.HttpContext?.Request.Cookies["timezone"];
        }

        public TimeZoneInfo GetCurrentTimeZone() {
            var tzId = timeZoneId ?? "UTC";

            try {
                return TimeZoneInfo.FindSystemTimeZoneById(tzId);
            } catch {
                return TimeZoneInfo.Utc;
            }
        }
    }
}

//Program.cs
...
using DevExpress.AspNetCore.Reporting;
using DevExpress.XtraReports.Services;
using DevExpressApp.Services;

var builder = WebApplication.CreateBuilder(args);
//...
builder.Services.AddScoped<ITimeZoneProvider, CustomTimeZoneProvider>();
//...
var app = builder.Build();
// ...
app.Run();
Line Spacing in Labels and Table Cells
The Web Report Designer now applies the LineSpacing property to text rendered in labels and table cells.
Angular 21 Support
Reporting for Desktop
Data Source Wizard — Favorite (Pinned) Data Sources
You can pin frequently used database providers as favorites in the Data Source Wizard for Visual Studio and WinForms/WPF Report Designers. Pinned providers appear at the top of the list on the Select a Data Connection Type page.

WinForms End-User Report Designer — Designer Settings Dialog
The WinForms Report Designer ships with a new Designer Settings dialog. This dialog allows users to configure report design and document generation settings globally at the app level. The dialog consolidates frequently used options, simplifies panel management, and streamlines customization of new reports created with the Report Wizard.
The Designer Settings dialog “groups” settings into the following categories:
- General – Report Designer UI and dock panel settings
- Data – Application-wide data binding and schema discovery settings
- New Report – Default layout, appearance, and script settings for newly created reports
- Export – PDF and CSV export-related settings

You can restrict access to the Designer Settings dialog and prevent users from changing global report design or export settings. To disable access to this dialog, call the XRDesignMdiController.SetCommandVisibility(ReportCommand, CommandVisibility) method:
reportDesigner1.SetCommandVisibility(ReportCommand.Settings, CommandVisibility.None);
WinForms End-User Report Designer — High-DPI and Per-Monitor v2 Rendering Enhancements
We enhanced high-DPI and Per-Monitor v2 rendering for multiple Report Designer UI elements (to ensure consistent display quality and precise scaling in any display configuration, including multi-monitor setups with different DPI settings).
Updated elements include:
- Query Builder
- Master-Detail and Federation Data Source Editor
- Report Control Drag Handles
- Report Designer Toolbox
- Smart Tags and Verbs
- Data Source Drop-Down Editors