Create a Custom Palette
This document describes how to create a custom palette for painting a chart’s series.
To create a custom palette, click your chart’s smart tag, and choose the Palettes… link.
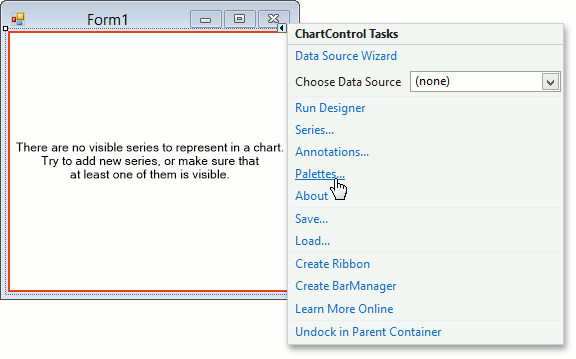
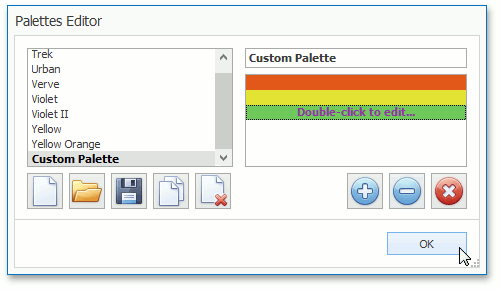
This will invoke the Palettes Editor, where you can manage the palettes collection, and create custom palettes.
Note
In addition, you can enable your end-users to specify pallettes and appearance for a chart themselves. The corresponding sample project is available in the DevExpress Code Central database at How to provide end-users with the capability to change a chart’s appearance on the fly.
See Also