Data Field
- 2 minutes to read
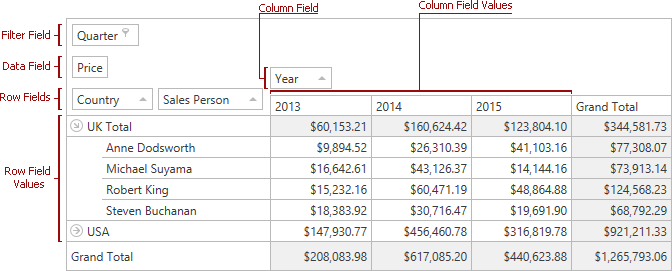
Data fields represent fields located in a pivot grid’s Data Header Area. The Pivot Grid calculates summaries against data fields. Summary results are displayed within the Data Area.
For numeric data fields the following summary functions can be calculated: Sum, Count, Min, Max, Average, Standard Deviation based upon a sample, Standard Deviation based upon an entire population, Variation based upon a sample and Variation based upon an entire population.
For non-numeric data fields the following summary functions are available: Count, Min and Max.
The following image shows the DXPivotGrid control that contains one data field - Sales.
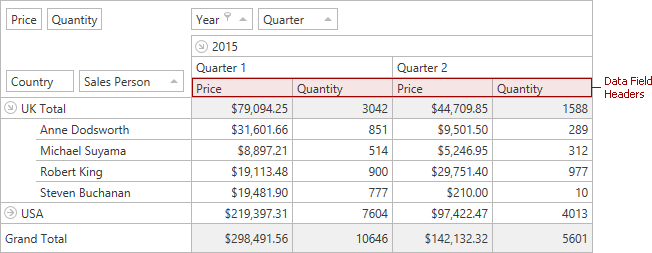
When there are two or more data fields, DXPivotGrid displays data field headers to distinguish between different summary values.
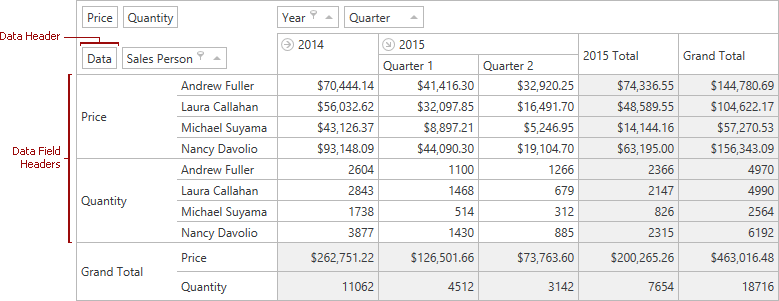
By default, data field headers are listed along the top of the control. It is possible to display data field headers along the left side of the control by setting the PivotGridControl.DataFieldArea property to DataFieldArea.RowArea. The PivotGridControl.DataFieldAreaIndex property specifies the position of the data field headers within the hierarchy of field values.
Setting the PivotGridControl.DataFieldArea property to DataFieldArea.ColumnArea or DataFieldArea.RowArea enables the data header. This header is linked with data field headers. It can be dragged to a specific position within a column header area or row header area, and data field headers will be moved to the associated location.
The following table lists the main properties affecting the element’s appearance.
Field Name and Caption | |
Bound Type | |
Summary Type | |
Visibility | |
Position |