PivotDataField.ShowValuesWithCalculation(PivotShowValuesAsType) Method
Applies the “Show values as” calculation option to the data field to change the way summary values are displayed within the report.
Namespace: DevExpress.Spreadsheet
Assembly: DevExpress.Spreadsheet.v18.2.Core.dll
Declaration
Parameters
| Name | Type | Description |
|---|---|---|
| calculationType | PivotShowValuesAsType | A PivotShowValuesAsType enumeration member specifying how summary values should be displayed within the data field. |
Remarks
When working with pivot tables, it is often more important to understand how a summary value correlates with other values in the data area than to know the summary value itself.
This method allows you to apply the following types of custom calculations to configure how summary values are displayed within a data field.
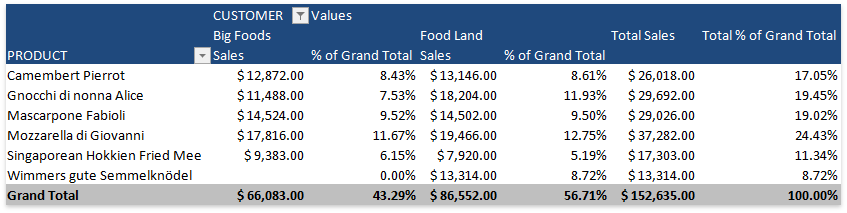
% of Grand Total (PivotShowValuesAsType.PercentOfTotal)
Displays values as the percentage of the grand total of all values in the PivotTable report.
The image below shows the pivot table with two data fields. The first one displays sales data summarized by the “Sum” function with no additional calculation applied, while the second one shows the percentage of product sales for each customer with respect to the PivotTable Grand Total value.
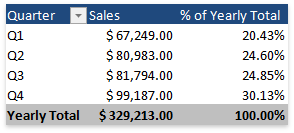
% of Column Total (PivotShowValuesAsType.PercentOfColumn)
Displays values in each column as the percentage of the total value of the column.
The pivot table shown below has two data fields. The first one displays sales data for four quarters summarized by the “Sum” function with no additional calculation applied, while the second one shows the percentage that each quarter’s sales value represents of the yearly total value.
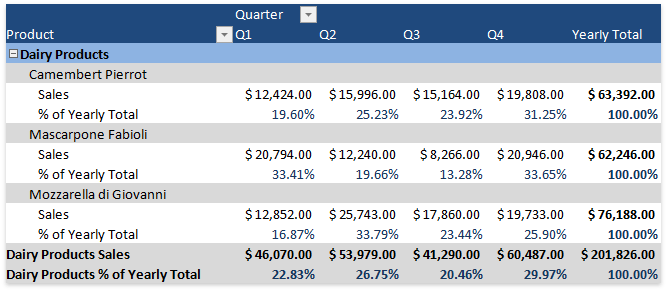
% of Row Total (PivotShowValuesAsType.PercentOfRow)
Displays values in each row as the percentage of the total value of the row.
The following image shows the pivot table with two data fields. The first one displays sales data summarized by the “Sum” function with no additional calculation applied, while the second one shows the percentage for each quarter’s sales of a product with respect to the product’s annual sales.
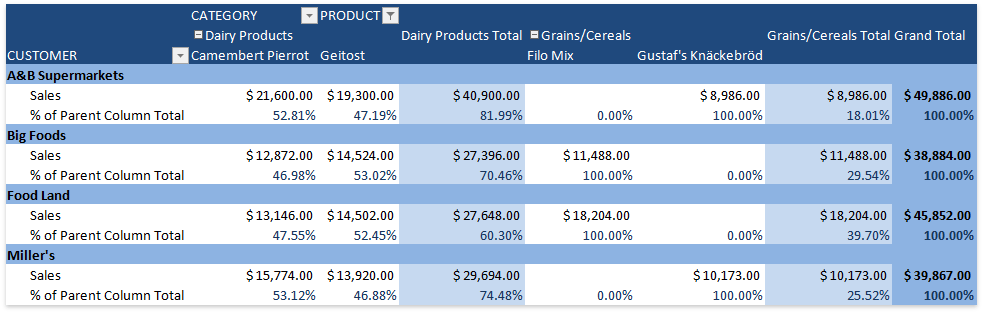
% of Parent Column Total (PivotShowValuesAsType.PercentOfParentColumn)
Displays values in each inner column as the percentage of the total of the parent item in the outer column. The parent column for the item values of the outermost column field is the grand total column.
The image below shows the pivot table with two data fields. The first one displays sales data summarized by the default “Sum” function, while the second one shows product sales for each customer as a percentage of the category’s total value and each total value in the “Category” field as a percentage of the Grand Total value for each customer.
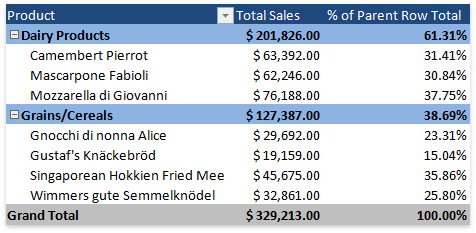
% of Parent Row Total (PivotShowValuesAsType.PercentOfParentRow)
Displays values in each inner row as the percentage of the total of the parent item in the outer row. The parent row for the item values of the outermost row field is the grand total row.
The image below shows the pivot table with two data fields. The first one displays sales data summarized by the default “Sum” function, while the second one shows each product’s sales as a percentage of its category total and each category’s total sales as a percentage of the Grand Total value.
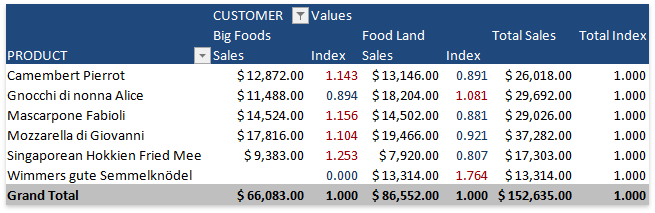
Index (PivotShowValuesAsType.Index)
Calculates the relative importance of each summary value by using the following formula:
((value in cell) x (Grand Total of Grand Totals)) / ((Grand Row Total) x (Grand Column Total))
To apply a calculation option that requires a base field, or a base field and base item, use the appropriate ShowValuesWithCalculation method overload. To remove any custom calculation applied to a data field, call the PivotDataField.ShowValuesWithoutCalculation method.
Related GitHub Examples
The following code snippets (auto-collected from DevExpress Examples) contain references to the ShowValuesWithCalculation(PivotShowValuesAsType) method.
Note
The algorithm used to collect these code examples remains a work in progress. Accordingly, the links and snippets below may produce inaccurate results. If you encounter an issue with code examples below, please use the feedback form on this page to report the issue.