How to: Display and Format Data Labels in Spreadsheet Documents
- 7 minutes to read
After you create a chart, you can display labels next to data points. If labels display point values, the control refreshes them automatically after data source updates. You can also display custom (unbound) information in labels.
Display Labels for All Series and Points in a Chart
The DataLabelOptions object defines basic data label settings. Use the ChartView.DataLabels property to retrieve the DataLabelOptions object.
Specify Data Label Content
Use the DataLabelOptions properties to specify what information should appear in each label.
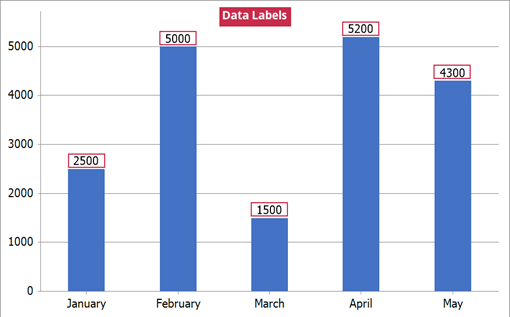
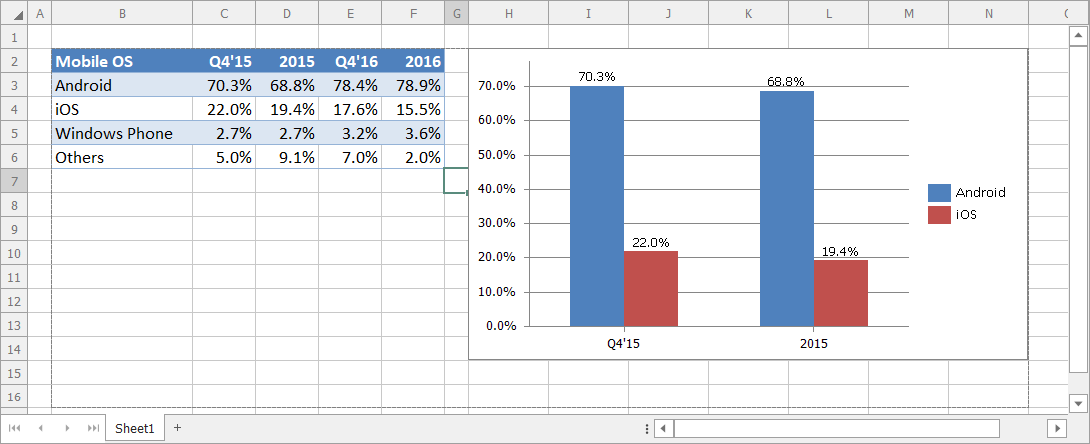
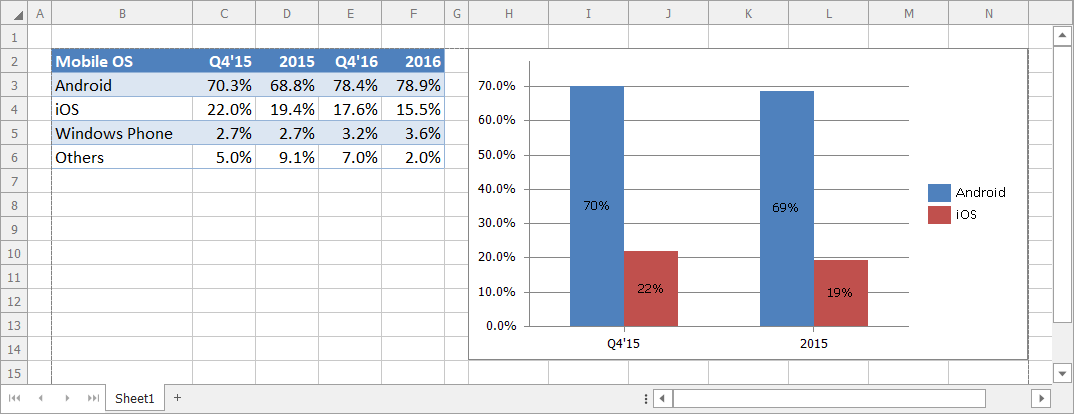
The example below demonstrates how to create a clustered column chart and display value labels for all series.
Worksheet worksheet = workbook.Worksheets["chartTask3"];
workbook.Worksheets.ActiveWorksheet = worksheet;

// Create a chart and specify its location.
Chart chart = worksheet.Charts.Add(ChartType.ColumnClustered, worksheet["B2:D4"]);
chart.TopLeftCell = worksheet.Cells["H2"];
chart.BottomRightCell = worksheet.Cells["N14"];

// Show data labels.
chart.Views[0].DataLabels.ShowValue = true;
The following content types are available:
| Label Contains | Description | API |
|---|---|---|
| Value | Data point value. | DataLabelOptions.ShowValue |
| Series name | Series name. | DataLabelOptions.ShowSeriesName |
| Category name | Argument value. This option can be useful in charts that do not display a category axis, such as pie or doughnut. | DataLabelOptions.ShowCategoryName |
| Percentage | Percentage of total. Available in pie and doughnut chart types only. | DataLabelOptions.ShowPercent |
| Bubble size | Bubble size. Only available in bubble charts. | DataLabelOptions.ShowBubbleSize |
| Legend key | A sample of the color and fill pattern used to draw the series. | DataLabelOptions.ShowLegendKey |
Specify the Position of Data Labels
You can use the DataLabelBase.LabelPosition property to adjust the positions of data labels. Assign one of the DataLabelPosition enumeration values to the LabelPosition property to specify the placement of data labels relative to their data markers.
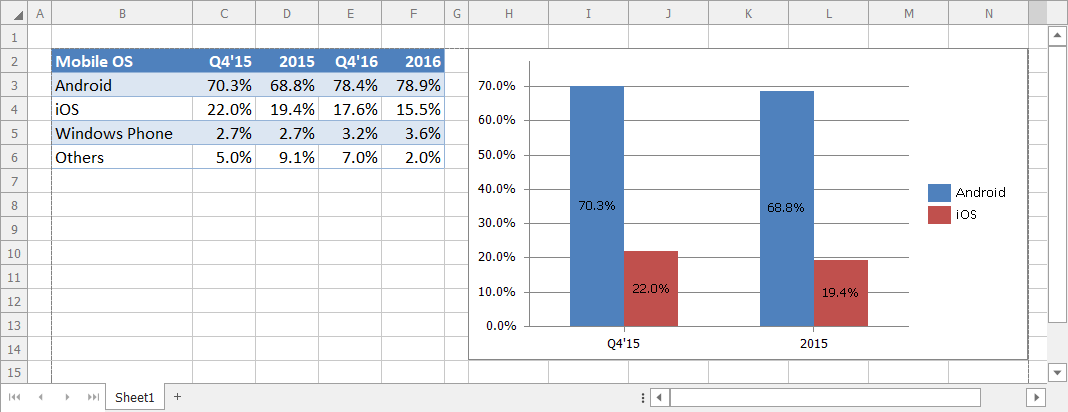
The example below demonstrates how to create a clustered column chart, enable data labels, and specify their location using the DataLabelBase.LabelPosition property. This example centers data labels within columns.
Worksheet worksheet = workbook.Worksheets["chartTask3"];
workbook.Worksheets.ActiveWorksheet = worksheet;

// Create a chart and specify its location.
Chart chart = worksheet.Charts.Add(ChartType.ColumnClustered, worksheet["B2:D4"]);
chart.TopLeftCell = worksheet.Cells["H2"];
chart.BottomRightCell = worksheet.Cells["N14"];

// Display data labels and specify their position within the chart.
chart.Views[0].DataLabels.ShowValue = true;
chart.Views[0].DataLabels.LabelPosition = DataLabelPosition.Center;
Specify a Separator
Options listed above allow you to populate labels with content. If you enabled more than one option, use the DataLabelBase.Separator property to separate label entries. The most frequently used separators are comma, semicolon, period, new line and space. You can also specify a custom separator.
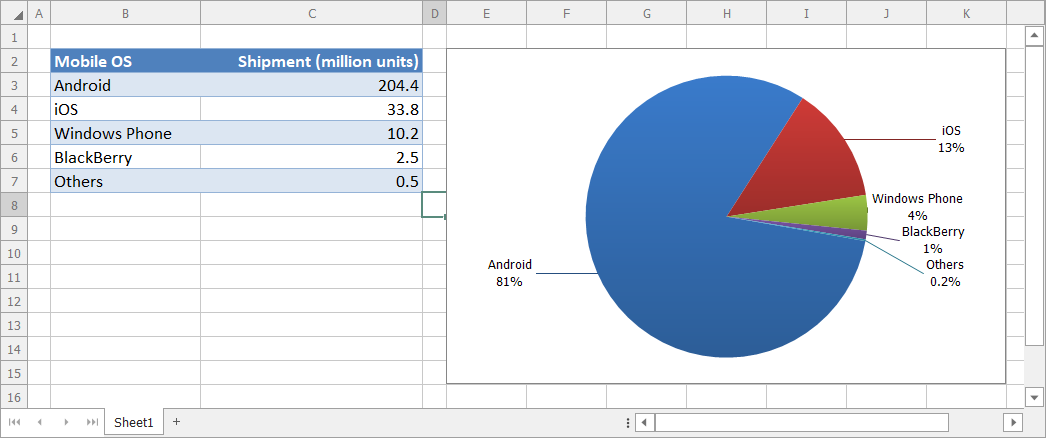
The example below demonstrates how to create a pie chart and adjust display settings of its data labels. Set the DataLabelBase.ShowCategoryName and DataLabelBase.ShowPercent properties to true to display both category names and percentage values in data labels. To separate these entries, assign a new line character to the DataLabelBase.Separator property. The percentage value appears on a separate line.
Worksheet worksheet = workbook.Worksheets["chartTask1"];
workbook.Worksheets.ActiveWorksheet = worksheet;

// Create a chart and specify its location.
Chart chart = worksheet.Charts.Add(ChartType.Pie, worksheet["B2:C7"]);
chart.TopLeftCell = worksheet.Cells["E2"];
chart.BottomRightCell = worksheet.Cells["K15"];

// Display the category name and percentage.
DataLabelOptions dataLabels = chart.Views[0].DataLabels;
dataLabels.ShowCategoryName = true;
dataLabels.ShowPercent = true;
dataLabels.Separator = "\n";

// Set the chart style.
chart.Style = ChartStyle.ColorGradient;
// Hide the legend.
chart.Legend.Visible = false;
// Set the angle of the first pie-chart slice.
chart.Views[0].FirstSliceAngle = 100;
Change Number Format in Data Labels
You can format numeric values in data labels. A number in a data label can appear in percentage, decimal, currency, scientific, fraction, text, accounting, date, time, or custom format. To apply a format, use the DataLabelBase.NumberFormat property. This property retrieves the NumberFormatOptions object. Assign the number format code to the NumberFormatOptions.FormatCode property. Set the NumberFormatOptions.IsSourceLinked property to false to indicate that the applied format differs from the number format of the worksheet cell that holds the data point value.
The example below demonstrates how to create a clustered column chart and format numeric values displayed in data labels as percentage values. To apply the number format, set the NumberFormatOptions.IsSourceLinked property to false and assign the corresponding format code to the NumberFormatOptions.FormatCode property.
Worksheet worksheet = workbook.Worksheets["chartTask3"];
workbook.Worksheets.ActiveWorksheet = worksheet;

// Create a chart and specify its location.
Chart chart = worksheet.Charts.Add(ChartType.ColumnClustered, worksheet["B2:D4"]);
chart.TopLeftCell = worksheet.Cells["H2"];
chart.BottomRightCell = worksheet.Cells["N14"];

// Display data labels and specify their position within the chart.
chart.Views[0].DataLabels.ShowValue = true;
chart.Views[0].DataLabels.LabelPosition = DataLabelPosition.Center;

// Format data labels.
chart.Views[0].DataLabels.NumberFormat.FormatCode = "0%";
chart.Views[0].DataLabels.NumberFormat.IsSourceLinked = false;
Display Labels for Individual Series or Data Points
You can display labels for individual series or even individual data points.
To display data labels for a specific series, set the Series.UseCustomDataLabels property to true. Use the Series.CustomDataLabels property to obtain the DataLabelCollection. Use the collection’s properties to show and modify data labels.
To display an individual data label, add a DataLabel instance to the DataLabelCollection collection with the index set to the index of the selected data point. Set the label’s DataLabelBase.ShowValue property to true (or use any other DataLabelBase.Show* property depending on the information you wish to display in the label). The DataLabel.Text property retrieves the ChartText object used to specify custom text for a data label. Use the ChartText.SetValue method to specify a new text for a data label, or utilize the ChartText.SetReference method to retrieve the text for a label from the worksheet cell.
Worksheet worksheet = workbook.Worksheets["chartTask3"];
workbook.Worksheets.ActiveWorksheet = worksheet;

// Create a chart and specify its location.
Chart chart = worksheet.Charts.Add(ChartType.ColumnClustered, worksheet["B2:D4"]);
chart.TopLeftCell = worksheet.Cells["H2"];
chart.BottomRightCell = worksheet.Cells["N14"];

// Display the data label for the last point of the second series.
chart.Series[1].CustomDataLabels.Add(1).ShowValue = true;
chart.Series[1].UseCustomDataLabels = true;
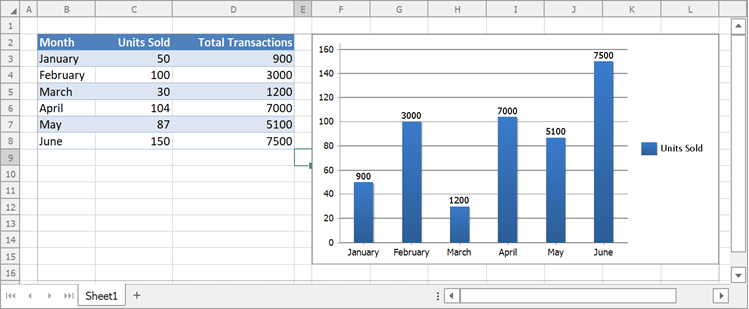
Use Cell Values as Data Labels
The DataLabelCollection.SetReference method allows you to specify a cell range that supplies values for data labels. You can use horizontal (row) or vertical (column) cell ranges. Set the Series.UseCustomDataLabels property to true.
The following code snippet uses cell values as data labels:
using DevExpress.Spreadsheet;
using DevExpress.Spreadsheet.Charts;

Worksheet worksheet = workbook.Worksheets["chartTask5"];
workbook.Worksheets.ActiveWorksheet = worksheet;

// Create a chart and specify its location
Chart chart = worksheet.Charts.Add(ChartType.ColumnClustered, worksheet["B2:C8"]);
chart.TopLeftCell = worksheet.Cells["F2"];
chart.BottomRightCell = worksheet.Cells["L15"];
// Specify the chart style
chart.Style = ChartStyle.ColorGradient;

chart.Series[0].UseCustomDataLabels = true;
var customDataLabels = chart.Series[0].CustomDataLabels;
customDataLabels.SetReference(worksheet["D3:D8"]);