How to: Add Trendline to a Chart in Spreadsheet Document API
- 3 minutes to read
The Spreadsheet Document API allows you to add trendlines to the chart series. Trendlines are available for the following chart types:
- 2D Bar
- 2D Column
- Bubble
- 2D Line
- Scatter
- Stock
The Trendline class defines a trendline. Use the Series.Trendlines property to retrieve the trendline collection of a specific chart series.
Add a Trendline
Call the TrendlineCollection.Add method to add a trendline. Use the Trendline object’s properties to specify the trendline properties.
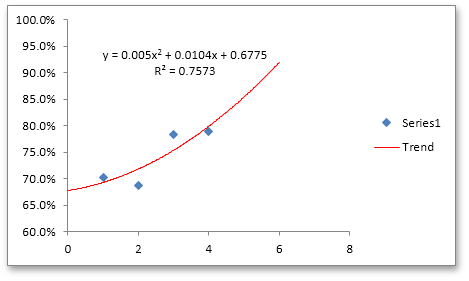
The following code uses the TrendlineCollection.Add method to display a trendline of the ChartTrendlineType.Polynomial type and customize it.
Worksheet worksheet = workbook.Worksheets["chartTask3"];
workbook.Worksheets.ActiveWorksheet = worksheet;

// Create a chart and specify its location.
Chart chart = worksheet.Charts.Add(ChartType.ScatterMarkers);
chart.SelectData(worksheet["C2:F3"], ChartDataDirection.Row);
chart.TopLeftCell = worksheet.Cells["H2"];
chart.BottomRightCell = worksheet.Cells["N14"];

// Set the minimum and maximum values for the chart value axis.
Axis axis = chart.PrimaryAxes[1];
axis.Scaling.AutoMax = false;
axis.Scaling.AutoMin = false;
axis.Scaling.Min = 0.6;
axis.Scaling.Max = 1.0;
chart.PrimaryAxes[1].MajorGridlines.Visible = false;

// Display a polynomial trendline.
chart.Series[0].Trendlines.Add(ChartTrendlineType.Polynomial);

// Customize the trendline.
Trendline tline = chart.Series[0].Trendlines[0];
tline.DisplayEquation = true;
tline.CustomName = "Trend";
tline.DisplayRSquare = true;
tline.Backward = 1;
tline.Forward = 2;
tline.Outline.SetSolidFill(Color.Red);
Note
The DisplayRSquare and DisplayEquation properties are ignored when you open a workbook in the WinForms or WPF Spreadsheet control. However, this property value is saved to the document, so you can use Microsoft® Excel® to view and process the workbook.
Specify a Trendline Label
To display a trendline label, set the Trendline.DisplayEquation or the Trendline.DisplayRSquare property to true.
The Trendline.Label property obtains the trendline label properties.
The code snippet below formats and positions a trendline’s label.
Worksheet worksheet = workbook.Worksheets["chartTask3"];
workbook.Worksheets.ActiveWorksheet = worksheet;

// Create a chart and specify its location.
Chart chart = worksheet.Charts.Add(ChartType.ScatterMarkers);
chart.SelectData(worksheet["C2:F3"], ChartDataDirection.Row);
chart.TopLeftCell = worksheet.Cells["H2"];
chart.BottomRightCell = worksheet.Cells["N14"];

// Display a polynomial trendline.
chart.Series[0].Trendlines.Add(ChartTrendlineType.Polynomial);

// Customize the trendline.
Trendline tline = chart.Series[0].Trendlines[0];
tline.DisplayEquation = true;
tline.CustomName = "Trend";
tline.DisplayRSquare = true;
tline.Outline.SetSolidFill(Color.Red);

// Format the trend label.
TrendlineLabel tlabel = tline.Label;
tlabel.Font.Name = "Tahoma";
tlabel.Font.Italic = true;
tlabel.Fill.SetGradientFill(ShapeGradientType.Linear, Color.Orange, Color.White);
// Position the label in the right quarter of the chart area.
tlabel.Layout.Left.SetPosition(LayoutMode.Edge, 0.75);