NumericRange.VisualMax Property
Gets or sets the end value of the axis range that is currently displayed on a screen.
Namespace: DevExpress.XamarinForms.Charts
Assembly: DevExpress.XamarinForms.Charts.dll
NuGet Package: DevExpress.XamarinForms.Charts
Declaration
public double VisualMax { get; set; }Property Value
| Type | Description |
|---|---|
| Double | The end value of the on-screen range. Note that this value should be within the [Min, Max] range. |
Example
This example shows how to configure the numeric y-axis scale range. To do this, assign a NumericRange object with the specified properties to the NumericAxisY.Range property.
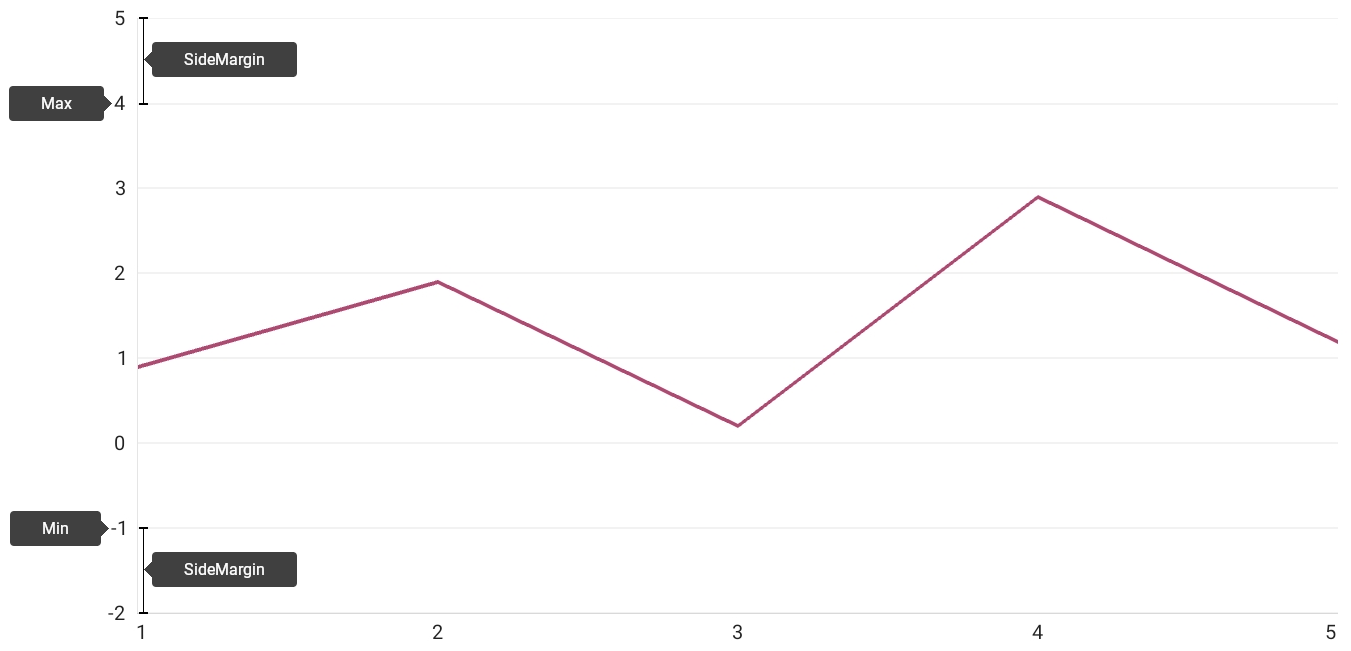
Whole Range and Side Margins
Use the Min and Max properties to specify the whole range of the axis scale. A chart does not visualize data that is out of this range. An end user can scroll the chart through this range when scrolling is enabled for the y-axis (ChartView.AxisYNavigationMode).
Use the RangeBase.SideMargin property to specify the value of indents on both sides of the axis.
<dxc:ChartView>
    <dxc:ChartView.AxisY>
        <dxc:NumericAxisY>
            <dxc:NumericAxisY.Range>
                <dxc:NumericRange Min="-1" Max="4" SideMargin="1"/>
            </dxc:NumericAxisY.Range>
        </dxc:NumericAxisY>
    </dxc:ChartView.AxisY>
</dxc:ChartView>
Visual Range
Use the VisualMin and VisualMax properties to set an axis scale range currently displayed on a screen.
<dxc:ChartView>
    <dxc:ChartView.AxisY>
        <dxc:NumericAxisY>
            <dxc:NumericAxisY.Range>
                <dxc:NumericRange VisualMin="-0.5" VisualMax="3"/>
            </dxc:NumericAxisY.Range>
        </dxc:NumericAxisY>
    </dxc:ChartView.AxisY>
</dxc:ChartView>
