How to: Obtain the Dashboard Item's Client Data
- 4 minutes to read
The following example demonstrates how to obtain client data for a particular visual element using DashboardControl‘s API.
In this example, the DashboardControl.DashboardItemMouseUp event is handled to obtain client data for the Card dashboard item and display this data in a Chart control.
We obtain axis points placed on the “Sparkline” axis for the clicked card, determine corresponding actual/target values, and save these values to a data table. This table is used as a data source for the Chart control.
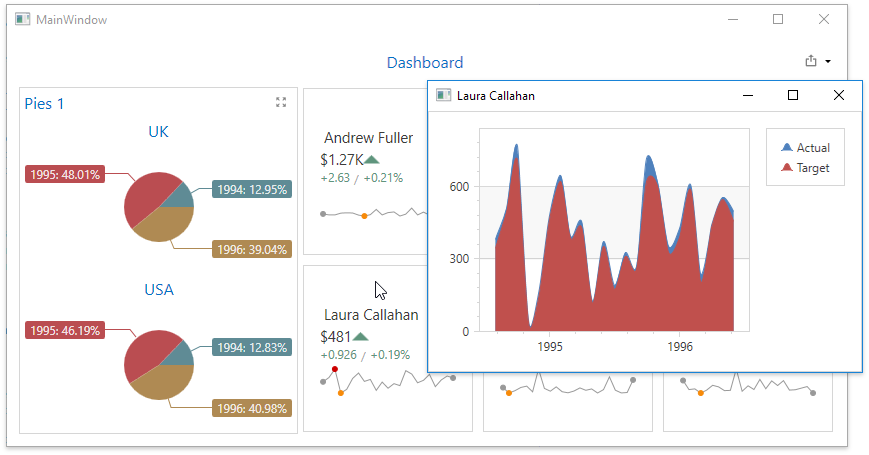
The Pie dashboard item demonstrates the master filtering feature. Click the slice and the Cards will display client data by the selected year.
Note
The complete sample project How to handle a mouse click to obtain dashboard item data is available in the DevExpress Examples repository.
using DevExpress.DashboardCommon;
using DevExpress.DashboardCommon.ViewerData;
using DevExpress.DashboardWpf;
using DevExpress.Xpf.Charts;
using System;
using System.Data;
using System.Windows;

namespace Dashboard_ClientDataCards_Wpf
{
    /// <summary>
    /// Interaction logic for MainWindow.xaml
    /// </summary>
    public partial class MainWindow : Window
    {
        public MainWindow()
        {
            InitializeComponent();
        }

        // Handles the DashboardControl_DashboardItemMouseUp event.
        private void DashboardControl_DashboardItemMouseUp(object sender, DashboardItemMouseActionWpfEventArgs e)
        {
            if (e.DashboardItemName == "cardDashboardItem1" & e.GetAxisPoint() != null)
            {
                // Obtains client data related to the clicked card.
                MultiDimensionalData clickedItemData = e.GetSlice();
                DeltaDescriptor delta = e.GetDeltas()[0];

                // Creates a data table that will be used to hold client data.
                DataTable dataSource = new DataTable();
                dataSource.Columns.Add("Argument", typeof(DateTime));
                dataSource.Columns.Add("Actual", typeof(double));
                dataSource.Columns.Add("Target", typeof(double));

                // Saves values of axis points placed on the "sparkline" axis and corresponding
                // actual/target values to the data table.
                foreach (AxisPoint point in
                    clickedItemData.GetAxisPoints(DashboardDataAxisNames.SparklineAxis))
                {
                    DataRow row = dataSource.NewRow();
                    DeltaValue deltaValue = clickedItemData.GetSlice(point).GetDeltaValue(delta);
                    if (deltaValue.ActualValue.Value != null &&
                        deltaValue.TargetValue.Value != null)
                    {
                        row["Argument"] = point.Value;
                        row["Actual"] = deltaValue.ActualValue.Value;
                        row["Target"] = deltaValue.TargetValue.Value;
                    }
                    else
                    {
                        row["Argument"] = DBNull.Value;
                        row["Actual"] = DBNull.Value;
                        row["Target"] = DBNull.Value;
                    }
                    dataSource.Rows.Add(row);
                }
                DisplayDetailedChart(GetFormTitle(clickedItemData), dataSource);
            }
        }

        // Creates a new form that is invoked on the card click and
        // shows the chart displaying client data.
        void DisplayDetailedChart(string title, DataTable dataSource)
        {
            DetailedChart detailWindow = new DetailedChart();
            detailWindow.Title = title;

            ChartControl chart = detailWindow.detailedChartControl;
            XYDiagram2D diagram = new XYDiagram2D();
            chart.Diagram = diagram;
            SplineAreaSeries2D series1 = new SplineAreaSeries2D();
            series1.DisplayName = "Actual";
            SplineAreaSeries2D series2 = new SplineAreaSeries2D();
            series2.DisplayName = "Target";
            diagram.Series.AddRange(new Series[] { series1, series2 });

            foreach (Series series in diagram.Series)
            {
                series.DataSource = dataSource; series.ArgumentDataMember = "Argument";
                series.ValueScaleType = ScaleType.Numerical;
            }

            series1.ValueDataMember = "Actual";
            series2.ValueDataMember = "Target";

            detailWindow.ShowDialog();
        }

        // Obtains a value of the axis point placed on the "default" axis
        // to display this value in the invoked form title.
        string GetFormTitle(MultiDimensionalData clickedItemData)
        {
            AxisPoint clickedPoint = clickedItemData.GetAxisPoints(DashboardDataAxisNames.DefaultAxis)[0];
            string clickedPointValue = clickedPoint.Value.ToString();
            return clickedPointValue;
        }
    }
}