Chart Control
- 2 minutes to read
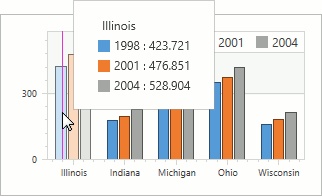
The DevExpress ChartControl for WPF is powerful visualization tool that helps you display your data as 2D or pseudo 3D bars, areas, lines and many other forms.
| This section contains tutorials that are intended to help first-time users get acquainted with the DevExpress ChartControl for WPF. |
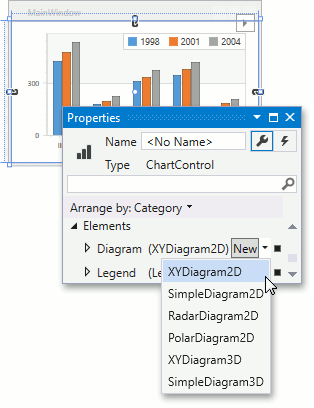
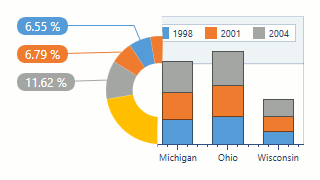
| The Chart control supports a wide variety of diagram types, for example simple diagram or XY-diagram. Using these diagram types, the Chart control can display many different series types, like areas, bars, lines, among others. Moreover, the financial data can be visualized using the Chart control. |
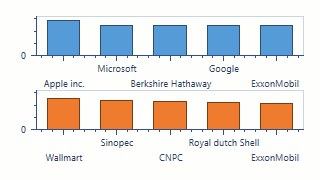
| The Chart control allows you to provide data in several different ways. First, you can manually create a series, and then populate points manually or automatically generate from a data source. Secondly, it is possible to automatically generate series using the series template. Also, the Chart control supports data aggregation and color providing. |
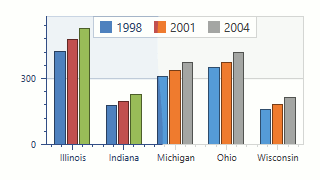
| The Chart control is shipped with several predefined themes and palettes allowing you to customize the chart appearence as you want. To specify the appearance of the series, you can use one of the series and marker models supported by the Chart control. If out of the box models do not meet your expectations, the Chart control supports the custom draw events. |
| The Chart control supports the simple end-user interaction in addition to the following interaction features. |
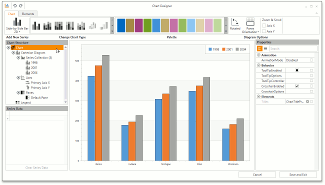
| The Chart control can be easily and rapidly customized using the Chart Designer and Pattern Editor. |