Providing Data
- 5 minutes to read
The Dashboard Designer allows you to bind dashboard items to data in a uniform and similar manner. See the Bind Dashboard Items to Data topic for common information.
The difference is in the data sections that the specific dashboard item has. This topic describes how to bind the Range Filter dashboard item to data in the Designer or in code.
Binding to Data in the Designer
The image below shows a sample Range Filter dashboard item that is bound to data.
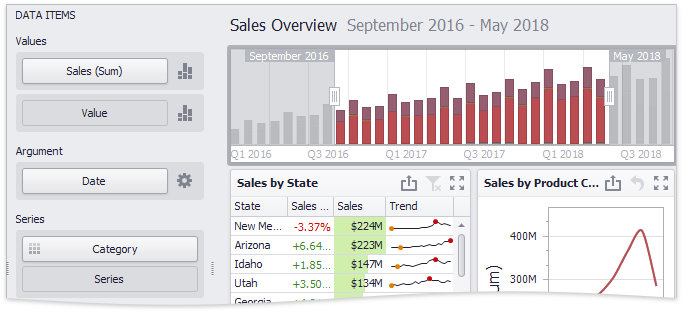
To bind the Range Filter dashboard item to data, drag and drop a data source field to a placeholder contained in one of the available data sections. A table below lists and describes Range Filter data sections.
Section | Processed as | Description |
|---|---|---|
Values | Contains data items against which the Y-coordinates of data points are calculated. | |
Argument | Contains a data item that provides values displayed along the horizontal axis of the Range Filter. These values are used for filtering. You can use only continuous Date and Numeric values as arguments (for example, DateTime, DateOnly, Decimal and others). Discrete types like String or TimeOnly are not supported. Note Note that the Options button (the | |
Series | Contains data items whose values are used to create chart series. |
 icon) allows you to create
 Binding to Data in Code
To provide data for the Range Filter dashboard item, use the following properties.
Argument | |
Series | |
Values | To provide values that determine the Y-coordinate of data points, do the following.
|
Example
using DevExpress.DashboardCommon;
using DevExpress.DataAccess.Excel;
using DevExpress.XtraEditors;
using System;

namespace Dashboard_CreateRangeFilter
{
    public partial class Form1 : XtraForm
    {
        public Form1()
        {
            InitializeComponent();
        }
        private RangeFilterDashboardItem CreateRangeFilter(IDashboardDataSource dataSource)
        {
            RangeFilterDashboardItem rangeFilter = new RangeFilterDashboardItem();
            rangeFilter.DataSource = dataSource;
            SimpleSeries salesAmountSeries = new SimpleSeries(SimpleSeriesType.Area);
            rangeFilter.Series.Add(salesAmountSeries);
            salesAmountSeries.Value = new Measure("Extended Price");
            rangeFilter.Argument = new Dimension("OrderDate");
            rangeFilter.Argument.DateTimeGroupInterval = DateTimeGroupInterval.MonthYear;
            rangeFilter.FilterString = "[OrderDate] > #2018-01-01#";
            rangeFilter.DateTimePeriods.AddRange(
                DateTimePeriod.CreateLastYear(),
                DateTimePeriod.CreateNextMonths("Next 3 Months", 3),
                new DateTimePeriod
                { Name = "Year To Date",
                  Start = new FlowDateTimePeriodLimit(DateTimeInterval.Year, 0),
                  End = new FlowDateTimePeriodLimit(DateTimeInterval.Day, 1)
                },
                new DateTimePeriod
                { Name = "Jul-18-2018 - Jan-18-2019",
                  Start = new FixedDateTimePeriodLimit(new DateTime(2018, 7, 18)),
                  End = new FixedDateTimePeriodLimit(new DateTime(2019, 1, 18)) }
                );
            rangeFilter.DefaultDateTimePeriodName = "Year To Date";
          // The caption is initially hidden. Uncomment the line below to show the caption.
          //rangeFilter.ShowCaption = true;
            return rangeFilter;
        }

        private PivotDashboardItem CreatePivot(IDashboardDataSource dataSource)
        {
            PivotDashboardItem pivot = new PivotDashboardItem();
            pivot.DataSource = dataSource;
            pivot.Columns.AddRange(new Dimension("Country"), new Dimension("Sales Person"));
            pivot.Rows.AddRange(new Dimension("CategoryName"), new Dimension("ProductName"));
            pivot.Values.AddRange(new Measure("Extended Price"), new Measure("Quantity"));
            pivot.AutoExpandColumnGroups = true;
            return pivot;
        }

        private DashboardExcelDataSource CreateExcelDataSource()
        {
            DashboardExcelDataSource excelDataSource = new DashboardExcelDataSource();
            excelDataSource.FileName = "SalesPerson.xlsx";
            ExcelWorksheetSettings worksheetSettings = new ExcelWorksheetSettings("Data");
            excelDataSource.SourceOptions = new ExcelSourceOptions(worksheetSettings);
            excelDataSource.Fill();
            return excelDataSource;
        }
        private void Form1_Load(object sender, EventArgs e)
        {
            Dashboard dashboard = new Dashboard();

            DashboardExcelDataSource dataSource = CreateExcelDataSource();
            dashboard.DataSources.Add(dataSource);
            RangeFilterDashboardItem rangeFilter = CreateRangeFilter(dataSource);
            dashboard.Items.Add(rangeFilter);
            PivotDashboardItem pivot = CreatePivot(dataSource);
            dashboard.Items.Add(pivot);

            // Create the dashboard layout.
            dashboard.RebuildLayout();
            dashboard.LayoutRoot.FindRecursive(rangeFilter).Weight = 20;
            dashboard.LayoutRoot.FindRecursive(pivot).Weight = 80;
            dashboard.LayoutRoot.Orientation = DashboardLayoutGroupOrientation.Vertical;

            dashboardViewer1.Dashboard = dashboard;
            dashboardViewer1.ReloadData();
        }
    }
}