Master Filtering for the Chart Item in the WinForms
- 2 minutes to read
The BI Dashboard allows you to use a Chart dashboard item as a filter for other dashboard items (Master Filter). To learn more, see the Master Filtering topic that describes filtering concepts common to all dashboard items.
The Chart dashboard item supports filtering by argument, series or points.
Filtering by Arguments
When filtering by arguments is enabled, a user can click series points to make other dashboard items display only data related to selected argument values.
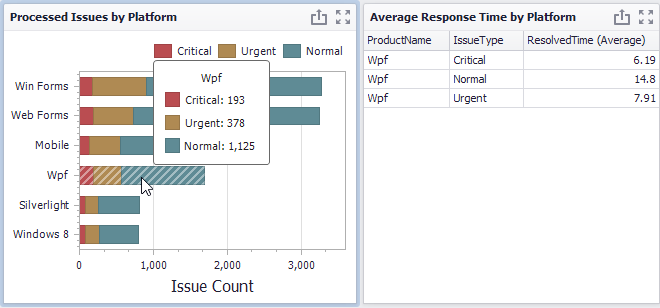
To enable filtering by arguments in the Designer, set the required Master Filter mode and click the Arguments button in the Data Ribbon tab of the Chart Tools contextual tab set.

Filtering by Series
When filtering by series is enabled, a user can click a series point to make other dashboard items display only data related to the selected series.
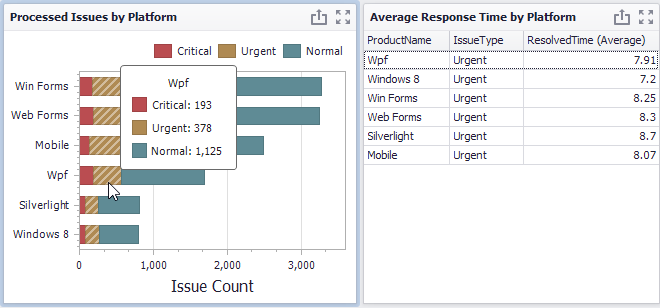
To enable filtering by series in the Designer, set the required Master Filter mode and click the Series button in the Data Ribbon tab of the Chart Tools contextual tab set.

Filtering by Points
When filtering by points is enabled, a user can click an individual point to make other dashboard items display only data related to the selected point.
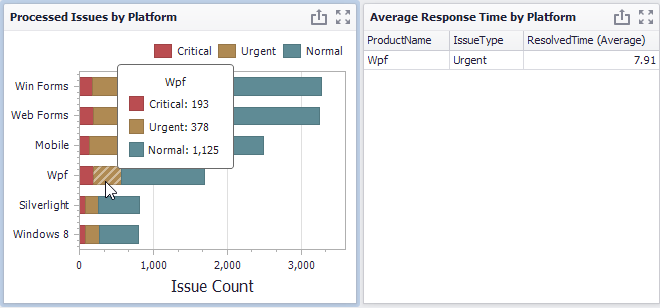
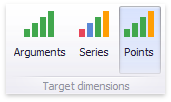
To enable filtering by points in the Designer, set the required Master Filter mode and click the Points button in the Data Ribbon tab of the Chart Tools contextual tab set.
Reset Filtering
To reset filtering, use the Clear Master Filter button (the  icon) in the Chart’s caption, or the Clear Master Filter command in the context menu.
Member Table
- DashboardItemInteractivityOptions.MasterFilterMode
- Gets or sets the selection mode of the master filter item.
- ChartDashboardItemBase.InteractivityOptions
- Provides access to interactivity options, such as Master Filtering and drill-down settings.