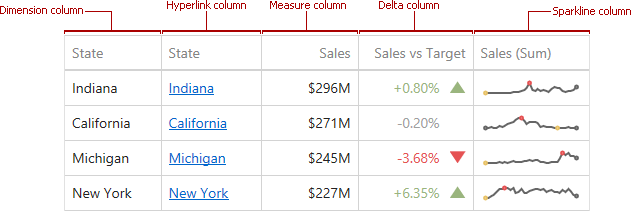
Sparkline Column
A Sparkline column visualizes the summary value changes over time.
Data Binding Specifics
To create GridSparklineColumn, you need to specify two data items:
- The measure providing sparkline values;
- The dimension providing a numeric or date-time interval.

Sparkline Options
You can control sparkline appearance settings using options from the Sparkline Options group. The following settings are available:
| Sparkline Options | Description | API |
|---|---|---|
| Show start/end values | Species whether to display sparkline start/end values within a grid cell. | GridSparklineColumn.showStartEndValues |
| View type | Defines the sparkline’s view type. Sparkline data points can be represented as area, line, bars, or win and loss squares. | SparklineOptions.viewType |
| Highlight min/max points | Specifies whether to highlight a sparkline’s minimum/maximum points. | SparklineOptions.highlightMinMaxPoints |
| Highlight start/end points | Specifies whether to highlight a sparkline’s start/end points. | SparklineOptions.highlightStartEndPoints |