Providing Data
- 3 minutes to read
The Web Dashboard allows you to bind dashboard items to data in a uniform and similar manner. See the Bind Dashboard Items to Data in the Web Dashboard’s UI topic for common information.
The difference is in the data sections that the specific dashboard item has. This topic describes how to bind the Bubble Map dashboard item to data.
Binding to Data in the Web Dashboard
The image below shows a sample Bubble Map dashboard item that is bound to data.
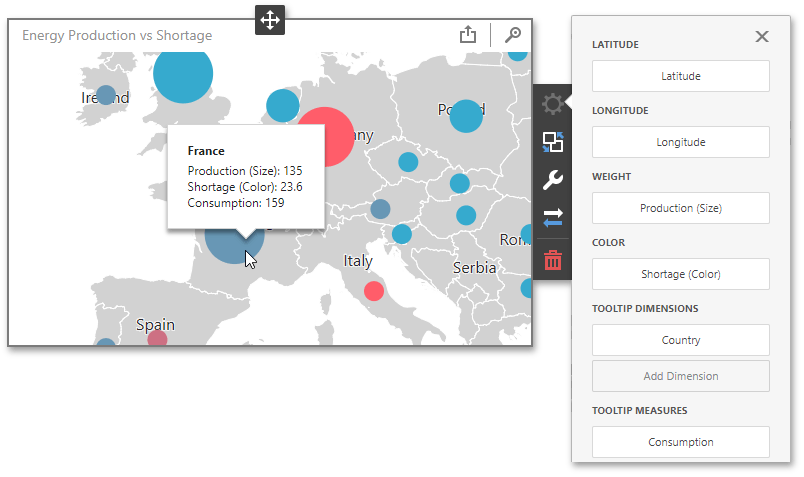
To bind the Bubble Map dashboard item to data, click a placeholder contained in one of the available data sections and select the required data source field in the Binding section of the invoked data item menu.
The tables below list and describes Bubble Map data sections.
| Section | API | Processed as | Description |
|---|---|---|---|
| Latitude | GeoPointMapItemBase.latitude | Dimension | Accepts a dimension used to provide geographic latitude. |
| Longitude | GeoPointMapItemBase.longitude | Dimension | Accepts a dimension used to provide geographic longitude. |
| Weight | BubbleMapItem.weight | Measure | Accepts a measure used to evaluate the bubble’s weight. |
| Color | BubbleMapItem.color | Measure | Accepts a measure used to evaluate the bubble’s color. |
The Bubble Map allows you to add supplementary content to the tooltips to provide additional data.
| Section | API | Processed as | Description |
|---|---|---|---|
| Tooltip Dimensions | GeoPointMapItemBase.tooltipDimensions | Dimension | Accepts dimensions allowing you to add supplementary content to the tooltips. |
| Tooltip Measures | MapItem.tooltipMeasures | Measure | Accepts measures allowing you to add summaries to the tooltips. |
Example
The following example shows how to create the Bubble Map dashboard item, bind it to data and add to the existing dashboard.
Create data items (measures and dimensions) and use the DataItem.dataMember property to bind them to the existing data source’s columns. Then use the created measures and dimensions in the dashboard item to bind it to data.
After you add the created dashboard item to the Dashboard.items collection, call the Dashboard.rebuildLayout method to rebuild the dashboard layout and display changes.
// Use the line below for a modular approach:
// import * as Model from 'devexpress-dashboard/model'
// Use the line below for an approach with global namespaces:
// var Model = DevExpress.Dashboard.Model;

// ...
public createBubbleMapItem() {
    // Create data items for the BubbleMap dashboard item.
    var bubbleMapImport = new Model.Measure();
    bubbleMapImport.dataMember("Import");
    var bubbleMapLatitude = new Model.Dimension();
    bubbleMapLatitude.dataMember("Latitude");
    var bubbleMapLongitude = new Model.Dimension();
    bubbleMapLongitude.dataMember("Longitude");
    var bubbleMapProduction = new Model.Measure();
    bubbleMapProduction.dataMember("Production");

    // Create the Bubble Map dashboard item and bind it to data.
    var bubbleMapItem = new Model.BubbleMapItem();
    bubbleMapItem.name('bubbleMap');
    bubbleMapItem.dataSource(excelDataSource.componentName());

    bubbleMapItem.latitude(bubbleMapLatitude);
    bubbleMapItem.longitude(bubbleMapLongitude);
    bubbleMapItem.area("Europe");
    bubbleMapItem.weight(bubbleMapImport);
    bubbleMapItem.color(bubbleMapProduction);

    control.dashboard().items.push(bubbleMapItem);
    // ...
    control.dashboard().rebuildLayout();
}