DxChartSeriesLabel.WordWrap Property
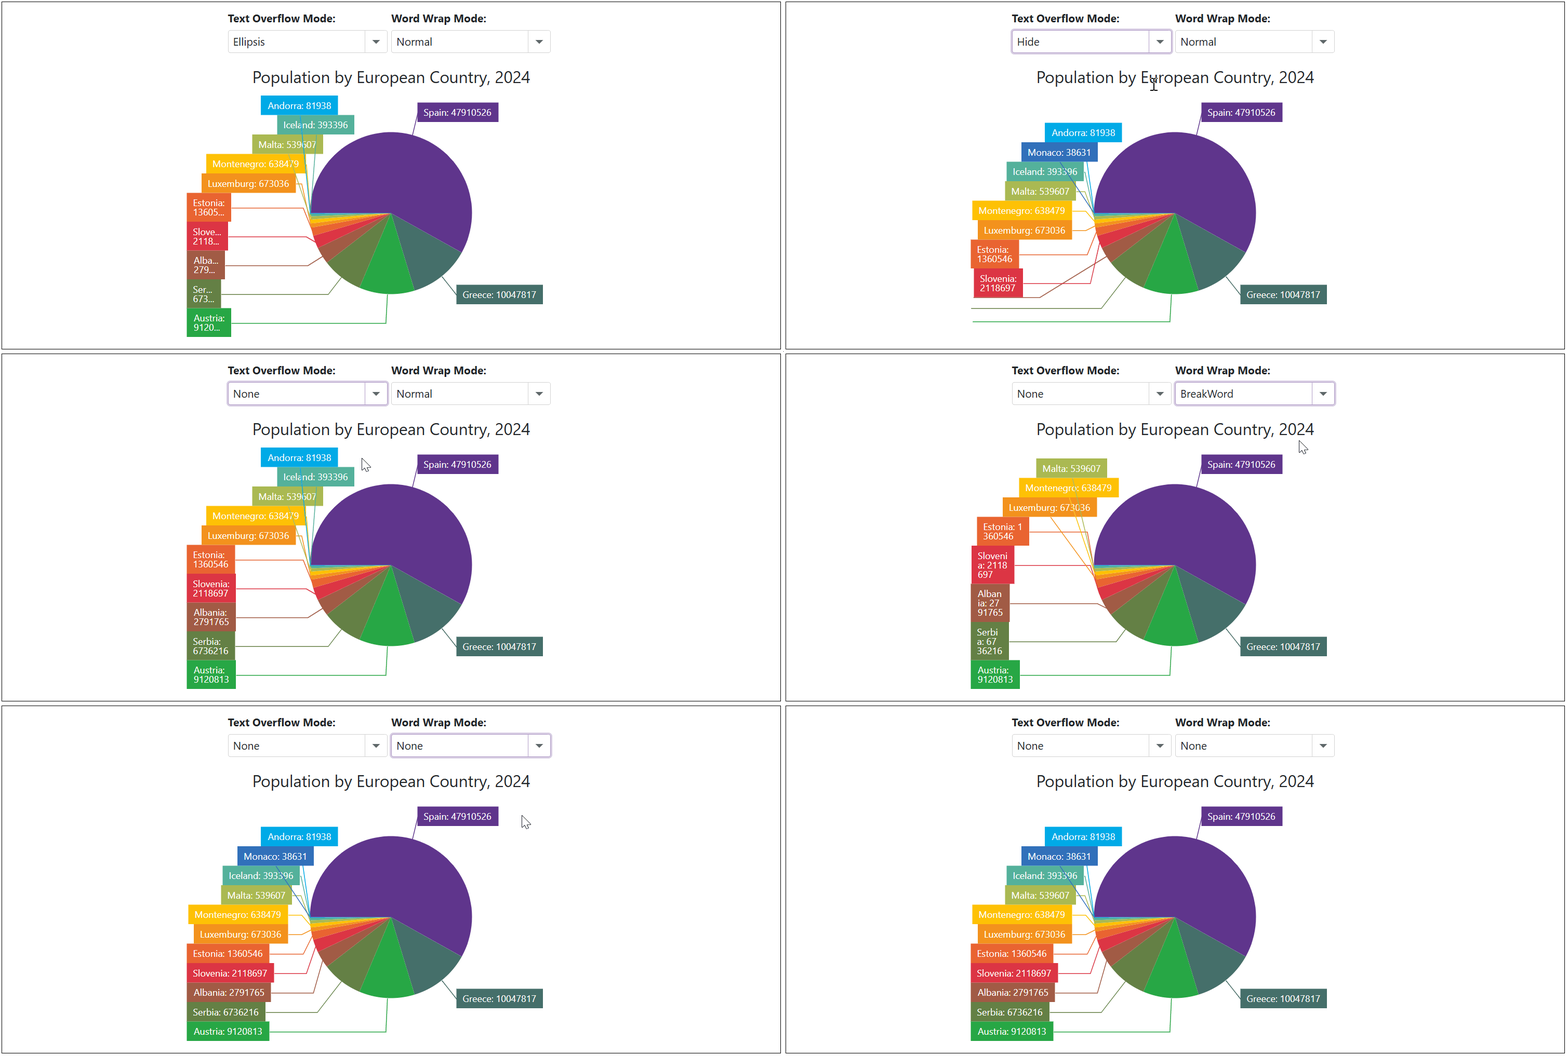
Specifies how the chart wraps text in overflowing pie series labels.
Namespace: DevExpress.Blazor
Assembly: DevExpress.Blazor.v25.1.dll
NuGet Package: DevExpress.Blazor
Declaration
[DefaultValue(ChartWordWrap.Normal)]
[Parameter]
public ChartWordWrap WordWrap { get; set; }
Property Value
| Type | Default | Description |
|---|---|---|
| ChartWordWrap | Normal | An enumeration value. |
Available values:
| Name | Description |
|---|---|
| Normal | Wraps text at standard breakpoints (spaces). |
| BreakWord | Wraps text and breaks words. |
| None | Keeps text on a single line. |
Remarks
In some cases, the DxPieChart component treats series labels as overflowing and wraps label text at space characters. Use the WordWrap property to change the wrap mode.
Additionally, you can use the TextOverflow property to define how to display overflowing series labels (hide, truncate with an allipsis, or display them completely).
Note
TextOverflow and WordWrap property values apply to DxPieChartSeries labels only.
Example
The following code snippet uses drop-down menus to choose how to display overflowing series labels:

<label><strong>Text Overflow Mode: </strong></label>
<DxComboBox Text="TextOverflow" @bind-Value="@CurrentTextOverflowMode" Data="Enum.GetValues<ChartTextOverflow>()" />

<label><strong>Word Wrap Mode: </strong></label>
<DxComboBox Text="WordWrap" @bind-Value="@CurrentWordWrapMode" Data="Enum.GetValues<ChartWordWrap>()" />

<DxPieChart Data="@DataSource"
            Height="350px"
            StartAngle="180"
            LabelOverlap="PieChartLabelOverlap.Shift"
            PointSelectionMode="ChartSelectionMode.Multiple">
    <DxPieChartSeries ArgumentField="@((StatisticPoint v) => v.Country)"
                      ValueField="@((StatisticPoint v) => v.Population24)"
                      Name="2024">
        <DxChartSeriesLabel Visible="true"
                            TextOverflow="@CurrentTextOverflowMode"
                            WordWrap="@CurrentWordWrapMode"
                            FormatPattern="{argument}: {value}">
            <DxChartSeriesLabelConnector Visible="true" />
        </DxChartSeriesLabel>
    </DxPieChartSeries>
    <DxChartLegend HorizontalAlignment="HorizontalAlignment.Right"
                   Orientation="Orientation.Vertical"
                   Visible="false" />
    <DxChartTitle Text="Population by European Country, 2024" />
</DxPieChart>

@code {
    TextOverflow CurrentTextOverflowMode { get; set; } = ChartTextOverflow.Ellipsis;
    WordWrap CurrentWordWrapMode { get; set; } = ChartWordWrap.Normal;

    IEnumerable<StatisticPoint> DataSource = Enumerable.Empty<StatisticPoint>();
    protected override void OnInitialized() {
        DataSource = GenerateData();
    }
}