DxChartAnnotationBase<T> Class
Defines the base API for classes that implement chart annotations.
Namespace: DevExpress.Blazor
Assembly: DevExpress.Blazor.v25.1.dll
NuGet Package: DevExpress.Blazor
Declaration
public class DxChartAnnotationBase<T> :
    DxComplexSettingsComponent<DxChartAnnotationBase<T>, T>,
    IModelProvider<ChartFontModel>,
    IModelProvider<ChartAnnotationBorderModel>,
    IModelProvider<ChartAnnotationShadowModel>,
    IModelProvider<ChartAnnotationImageModel>
    where T : ChartAnnotationBaseModel<T>
Type Parameters
| Name | Description |
|---|---|
| T | The data type. |
Remarks
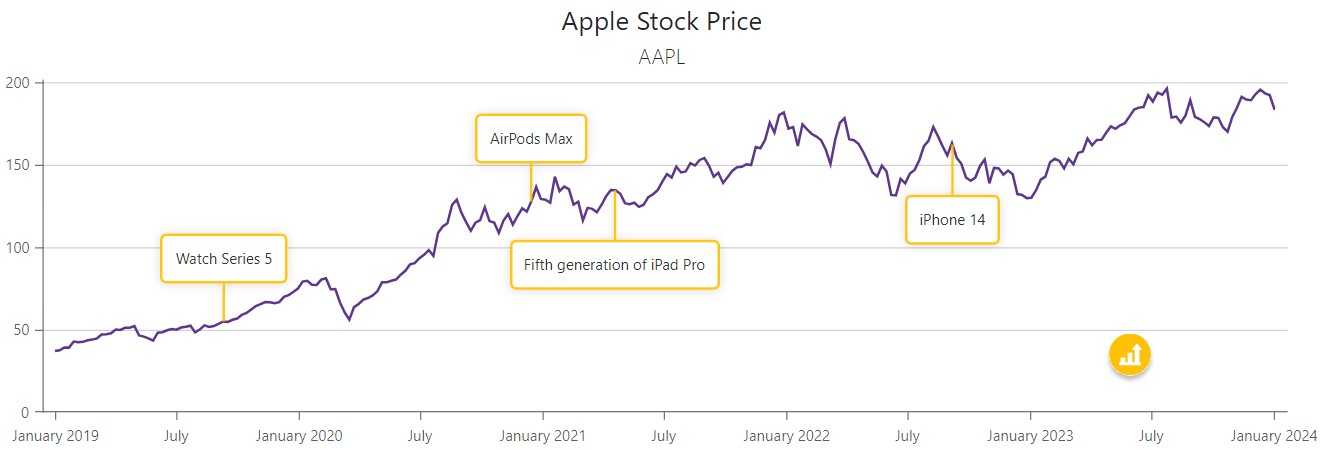
Annotations are comments that contain information about chart content. Chart components support text and image annotations. You can anchor annotations to chart elements (series points or axes) or position annotations based on pixel coordinates.
To create an annotation, follow the steps below:
Add an appropriate annotation object to chart markup (DxChartAnnotation for DxChart, DxPieChartAnnotation for DxPieChart).
Specify the annotation type and location.
Optional. Customize the annotation size and appearance, and configure tooltips.
<DxChart Data="@DataSource"
         Width="100%">
    <DxChartTitle Text="Apple Stock Price">
        <DxChartSubTitle Text="AAPL"></DxChartSubTitle>
    </DxChartTitle>
    <DxChartLegend Visible="false" />
    <DxChartArgumentAxis ArgumentType="ChartAxisDataType.DateTime" />
    <DxChartLineSeries ValueField="@((ApplePrice i) => i.Close)"
                       ArgumentField="@((ApplePrice i) => i.Date)"
                       Name="AAPL" />
    @foreach(var annotation in AnnotationSource) {
        <DxChartAnnotation Argument="@annotation.Argument"
                           Series="@annotation.Series"
                           Text="@annotation.Text"
                           VerticalOffset="@annotation.VerticalOffset"
                           TooltipText="@annotation.TooltipText"
                           ArrowWidth="0">
            <DxChartAnnotationBorder Color="#FFC107" Width="2" CornerRadius="4" />
        </DxChartAnnotation>
    }
    <DxChartAnnotation PositionX="900"
                       PositionY="230"
                       Type="ChartAnnotationType.Image"
                       TooltipText="Drag me"
                       Color="transparent"
                       AllowDrag="true"
                       PaddingLeftRight="0"
                       PaddingTopBottom="0">
        <DxChartAnnotationImage Url="@StaticAssetUtils.GetImagePath("AppleStock/stock.svg")"
                                Width="40"
                                Height="40" />
        <DxChartAnnotationBorder Visible="false" />
    </DxChartAnnotation>
</DxChart>

@code {
    IEnumerable<ApplePrice> DataSource = Enumerable.Empty<ApplePrice>();
    protected override void OnInitialized() {
        DataSource = ChartApplePriceDataProvider.GenerateData();
    }
    public class Annotation {
        public DateTime Argument { get; set; }
        public string Series { get; set; }
        public int VerticalOffset { get; set; }
        public string Text { get; set; }
        public string TooltipText { get; set; }
    }
    List<Annotation> AnnotationSource = new List<Annotation>() {
        new Annotation {
            Argument = new DateTime(2019, 9, 10),
            Series = "AAPL",
            Text = "Watch Series 5",
            VerticalOffset = -50,
            TooltipText = @"Apple Watch Series 5 was announced
                          on September 10, 2019."
        },
        new Annotation {
        Argument = new DateTime(2020, 12, 15),
            Series = "AAPL",
            Text = "AirPods Max",
            VerticalOffset = -50,
            TooltipText = @"AirPods Max — wireless Bluetooth over-ear
                          headphones — were released on December 15, 2020."
        },
        new Annotation {
            Argument = new DateTime(2021, 4, 20),
            Series = "AAPL",
            VerticalOffset = 60,
            Text = "Fifth generation of iPad Pro",
            TooltipText = @"The fifth generation of iPad Pro was announced
                          on April, 2021."
        },
        new Annotation {
            Argument = new DateTime(2022, 9, 7),
            Series = "AAPL",
            Text = "iPhone 14",
            VerticalOffset = 60,
            TooltipText = @"iPhone 14 and iPhone 14 Plus — sixteenth-generation
                          iPhones — were announced on September 7, 2022."
       }
    };
}
Refer to the following section for more information about annotations: Annotations in Blazor Charts.