Blazor Polar Chart
- 2 minutes to read
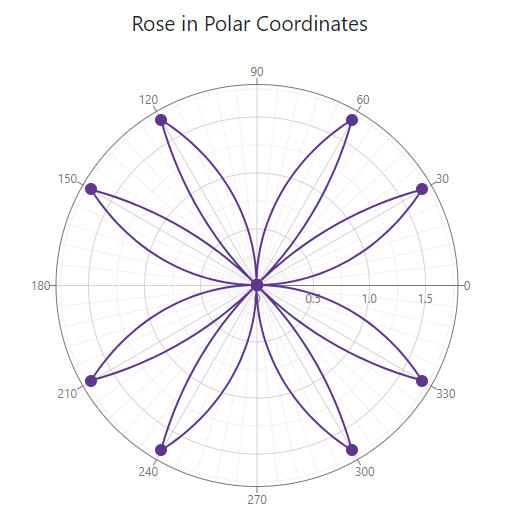
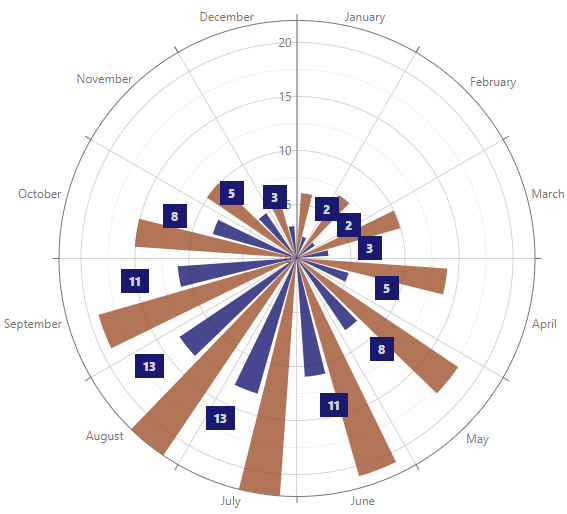
DevExpress Polar Chart for Blazor (<DxPolarChart>) allows you to visualize data within a polar coordinate system - where each point on a plane is determined by the distance from the center and the angle from a fixed direction.
API Reference
Refer to the following list for the component API reference: DxPolarChart Members.
Supported Series Types
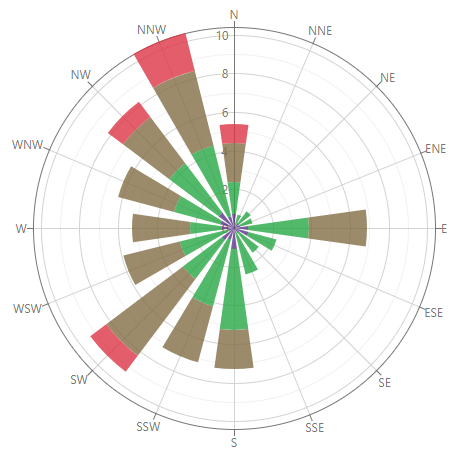
The DevExpress Blazor Chart component ships with different 2D chart types, such as area, bars, and lines.
Data Binding
The DevExpress Blazor Polar Chart supports various data binding scenarios:
For examples on how to bind to the most commonly used data collections, refer to the following sections:
Axes
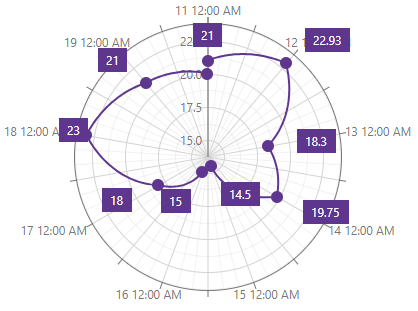
<DxPolarChart> allows you to configure its axes and their visual elements (ticks, titles, constant lines, and so on).
Spider Web
The DevExpress Blazor Polar Chart component allows you to display data as a polygon graph and render the chart as a “spider web”.

Labels
You can add labels to chart series and axes. You can format values and customize label appearance.
Descriptive Elements
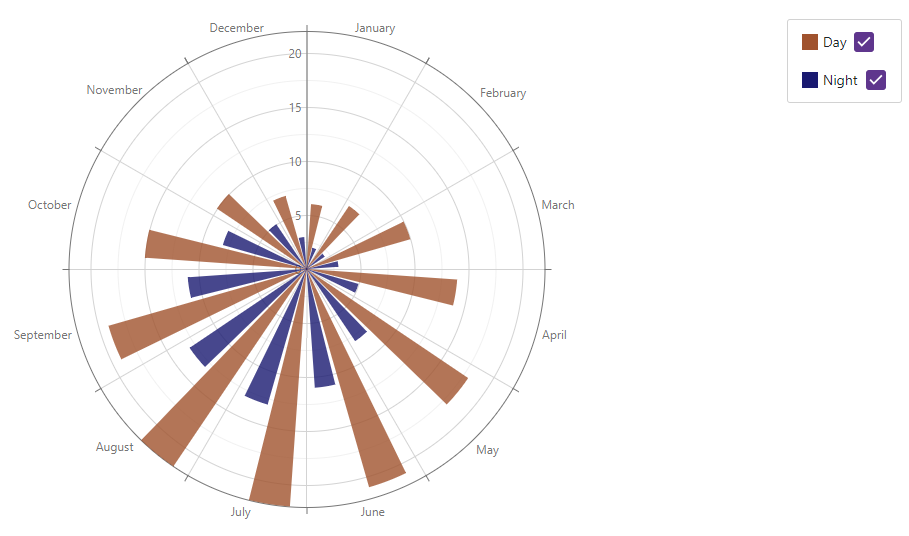
To help users understand visualized data, you can add descriptive elements to your charts – a legend, titles and subtitles, and tooltips.
Customization
DevExpress Charts for Blazor allow you to customize the appearance of nested/inner components and chart elements. You can also apply a custom color palette and change the component font.
User Interaction Options
DevExpress Blazor Charts allow users to interact with their content: users can select, click, and hover over series and points.
Export
You can export chart content as an encoded string in a specified format (PNG, PDF, JPEG, and GIF).