Main Features
- 4 minutes to read
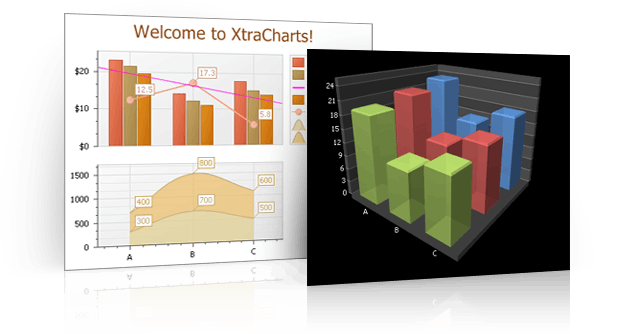
Featuring over 60 different chart types, the DevExpress ASP.NET Chart Control allows you to present complex data visually, as easy-to-understand graphs and diagrams.

The ASP.NET Chart Control ships with a wide variety of chart types (including financial charts and Gantt charts), a ready-to-use set of visual indicators, real-time monitoring tools, and analysis tools (including multi-dimensional analysis).
The Chart Control can visualize almost any data type, regardless of the data source, whether it is a database, an object collection, or a pivot grid. It also allows you to visualize large amounts of data, and provides high-level automation features to simplify 2D and 3D charting, while remaining flexible and efficient via an intuitive interface.
The main features of the ASP.NET Chart Control are divided into the following sections:
General Features
- Seamless integration with other DevExpress products such as the ASP.NET Pivot Grid (ASPxPivotGrid) and the Reporting Suite (XtraReports).
- Support for dozens of 2D and 3D chart types, ranging from simple charts (such as Bar, Column, Pie and Funnel) to advanced charts (such as Bubble, Gantt and Swift Plot).
- Support for financial charts (such as Stock and Candle Stick) and technical indicators (such as Regression Lines, Trend Lines, Fibonacci Indicators and Moving Average and Envelope).
- Real-life and smooth 3D rendering: support for True OpenGL rendering (with real light sources, shadows and flares) and full anti-aliasing (with clean, sharp lines and no rough edges), diagram rotation and perspective projection, and transparency (in most series types).
- Smart features and automation: smart series point labels, auto-adjustments to familiar data sources (such as the Pivot Grid), automatic scale breaks, automatic axis scale and range adjustments, and automatic date-time modes for the argument axis.
- Display of multiple series of diverse types: the ability to combine series of different types in the same diagram, and support for an unlimited number of panes and secondary axes, with scale breaks and logarithmic axis scales.
- Descriptive chart text: support for a flexible legend, an unlimited number of chart titles, text and image annotations, and multiple options for optimal layout adjustment.
- IIS clustered web environment support (Web Farm or Web Garden support).
Data Binding and Exchange
- Support for a variety of common data source types, including full ADO+ support.
- Unbound Mode - Specify values for the (X) and (Y) coordinates of points to populate a series with data manually. You can also combine bound and unbound series views in a single diagram.
- Binding Individual Series - The ASP.NET Chart Control can display data from multiple data sources, as each series can be bound to its own data table.
- Series Templates - In this mode, the ASP.NET Chart control creates series Views automatically, so there is no need to populate the Series collection manually.
- Series Data Filtering - Apply filter criteria to the data displayed by specific series, to filter unnecessary data.
- Series Data Sorting - Sort data within a series by its arguments or values.
- Series Data Summarization - Apply various summary functions to series data.
- Printing and Exporting - The ASP.NET Subscription includes the XtraPrinting Library, which allows you to easily export your chart to an image file (multiple file formats are supported), a PDF file, an image embedded in an HTML page, an image embedded in a Microsoft Excel spreadsheet, or a printed page.
For more information, see the following help topics:
Appearance Customization
- Appearance Customization For Individual Elements - Fully customize the appearance of a chart’s visual elements.
- Multiple Palettes for Automatic Series Coloring - Built-in appearance and palettes (or style schemes) allow you to paint chart elements and color series automatically. You can also define a separate palette for painting a chart’s indicators.
- Custom Draw - Special events allow you to change the appearance of each individual element, and draw custom graphics over your charts.
For more information, see the following help topic: Appearance Customization.
End-User Capabilities
- Interactivity - Hit-testing support for all chart elements.
- Coordinate Conversion - Support for point-to-diagram and diagram-to-point coordinate conversion, coupled with the capability to draw custom graphics over your chart, delivers many options for interactivity.