Ranges
- 2 minutes to read
In many cases, you may wish to visually identify specific ranges of values along scales in analog gauges (circular and linear). For instance, you may want to mark safe or critical value ranges. You can use custom ranges to implement this feature.
Ranges allow you to mark certain value ranges in circular and linear gauges. Visually, they are displayed as bars along scales. These bars can be rectangular in linear gauges or rounded in circular gauges.
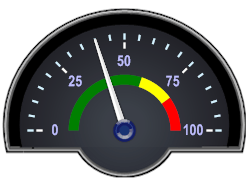
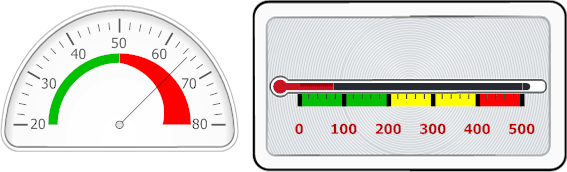
In the following image, a circular gauge contains two range bars (green and red), and a linear gauge contains three range bars (green, yellow and red).
Ranges belong to a scale. Use the scale’s Ranges collection (ArcScale.Ranges or LinearScale.Ranges) to create and access ranges.
Ranges may be instances of different classes depending on the gauge type:
In circular gauges - the ArcScaleRange class instance.
In linear gauges - the LinearScaleRange class instance.
Do the following to create a range at design time:
Click the Gauge control’s smart tag and select Customize Gauge Control…

Then, in the Visual Gauge Control Designer, click the scale’s smart tag and choose Run Designer.

In the Scales - Element Designer, click the Ranges… button, as shown below.

The Scale Ranges editor allows you to create new, and delete or customize existing ranges.
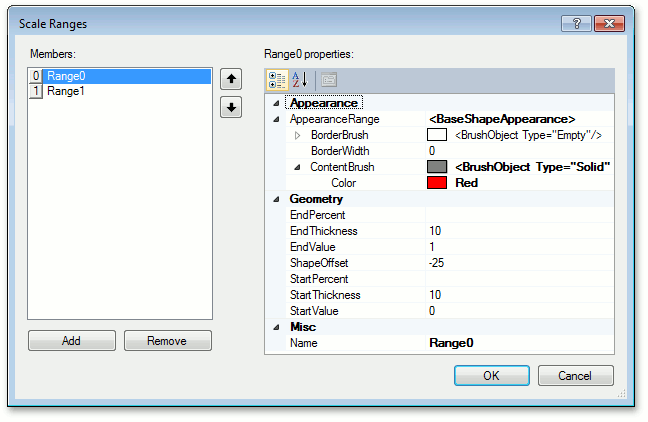
Each range contains properties that allow you to customize the range’s visual settings. The main properties are as follows:
BaseRange.StartValue and BaseRange.EndValue - specify the starting and ending absolute values for the range along the scale.
If you prefer to specify a range’s bounds as a percentage, use the ScaleRange.StartPercent and ScaleRange.EndPercent properties instead.
BaseRange.ShapeOffset - the offset of the bar’s edge from the scale axis in relative coordinates.
BaseRange.StartThickness and BaseRange.EndThickness - the thickness of the bar at the start and end points.
BaseRange.AppearanceRange - contains appearance settings for the range.