Display Average Values in Charts
Once you set up a data-bound XRChart control in a report, you can use expressions to supply values to chart’s UI elements such as constant line values, strip axis values, or chart titles.
Refer to the following topic for more information about expressions and expression binding objects: Expressions Overview.
The following tutorial explains how to bind a chart’s constant line to an expression that calculates the average of all displayed values.
Prerequisites
Refer to the following example for the generated report used in this tutorial:
Bind a Constant Line to an Expression
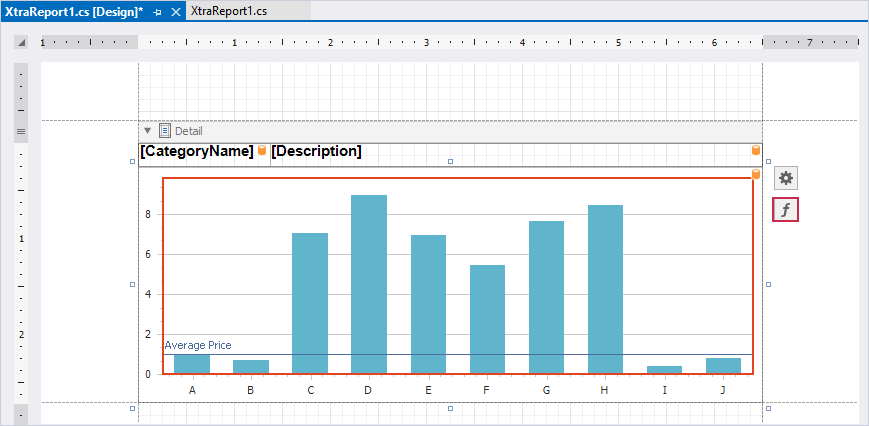
Select the XRChart control. The “f” button appears next to the selection. Click this button to invoke the Expression Editor:
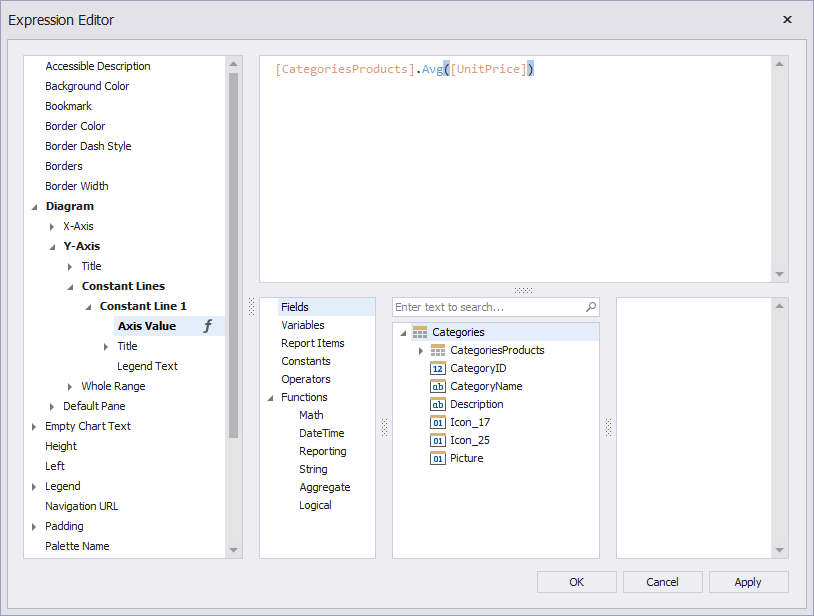
In the invoked editor, specify the following expression for the ConstantLine.AxisValue property and click OK.
[CategoriesProducts].Avg([UnitPrice])
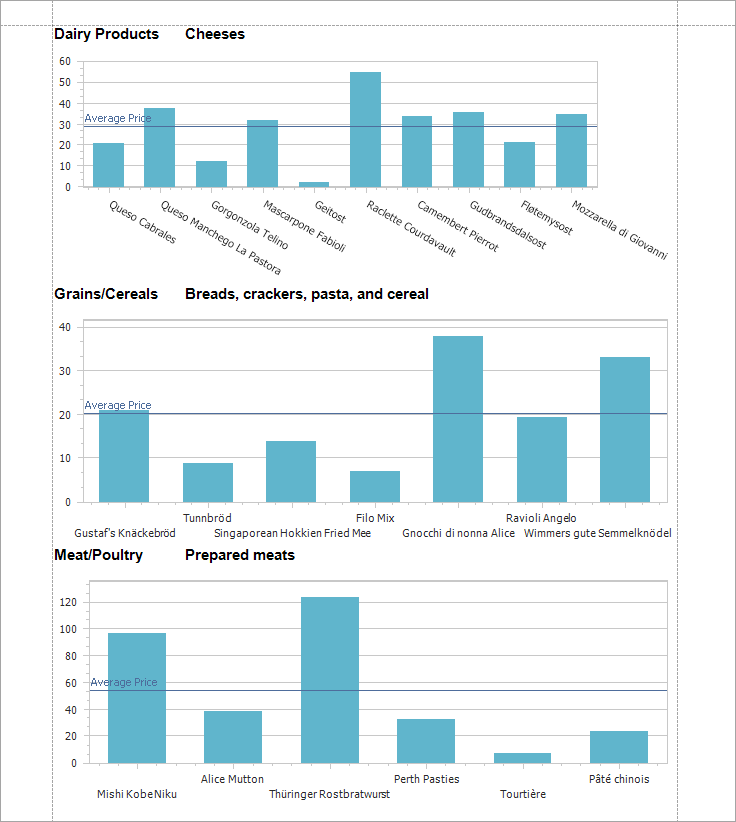
See the Result
Run the application. Constant lines show average product prices in each category.