Calculate a Weighted Average
- 3 minutes to read
This topic describes how to create a report that calculates a weighted average summary.
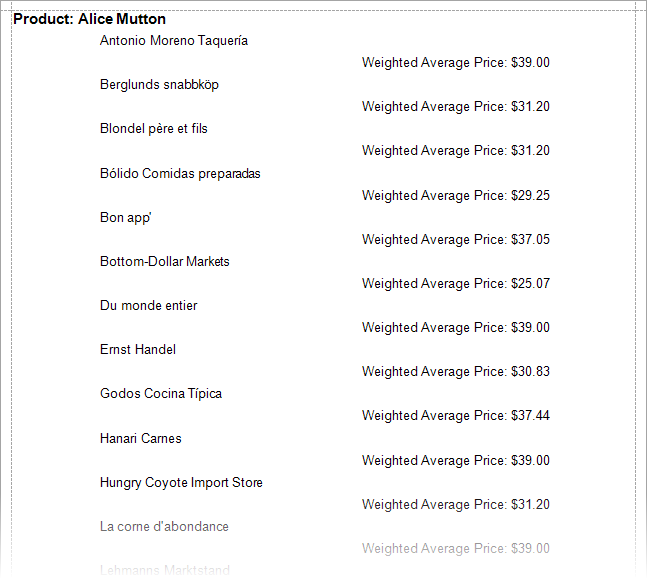
The sample report calculates the weighted average price by product for a company to which a product has been shipped. The report shows the product, the companies to which the product is shipped, and the weighted average price for that product:
Follow the steps in the sections below to create a sample report with a weighted average summary.
Bind a Report to Data
Add a new blank report to the project. Review the following help topic for details: Create a Report in Visual Studio.
Click Add Report Data Source in the report’s smart tag to invoke the Data Source Wizard, as illustrated in the following image:

Create a data source bound to the sample Northwind database.
Review the following help topic for more information on how to create a data source: Data Source Wizard.
Install the System.Data.SQLite.Core NuGet package to use the SQLite database.
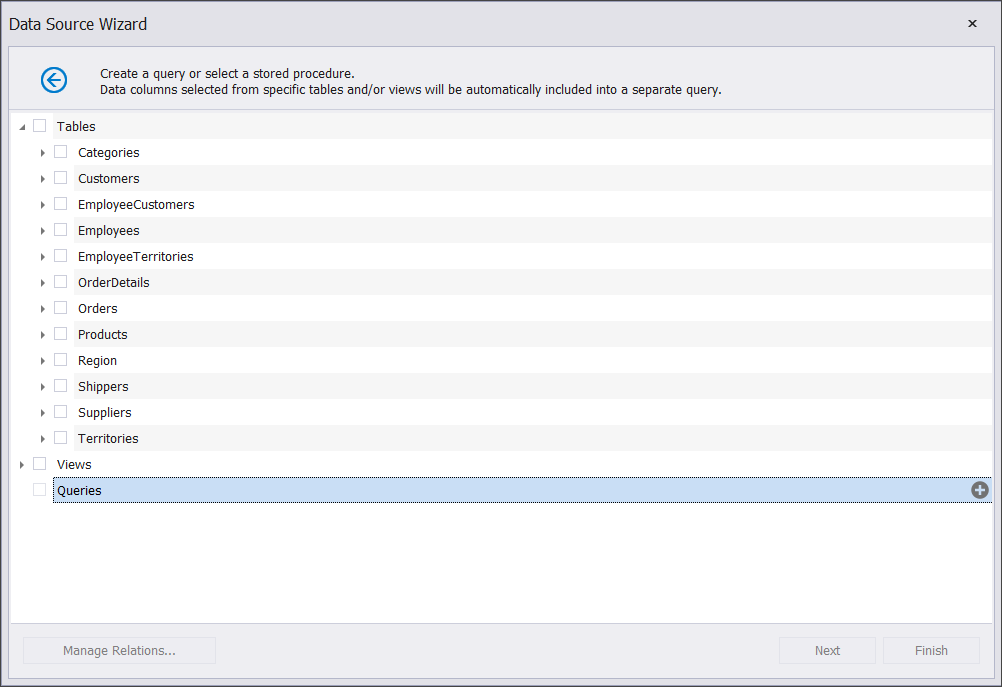
In the Data Source Wizard, click the plus (+) button to create a new query:
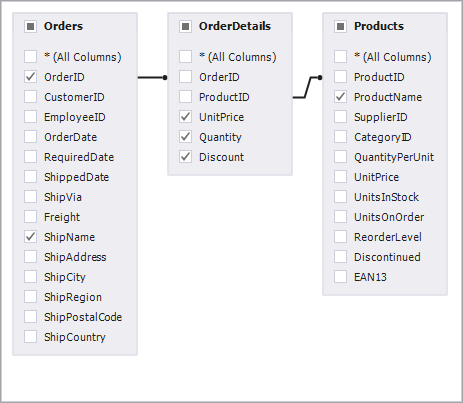
In the invoked Query Builder window, select tables and fields, and add relations as follows:
Group the Report Data
Use the Group and Sort panel to create a Group Header band associated with the
CategoryNamefield. If the panel is hidden, click Group and Sort in the XtraReports menu:
To create grouping criteria, click Add a Group and select the
ProductNamefield from the invoked drop-down menu: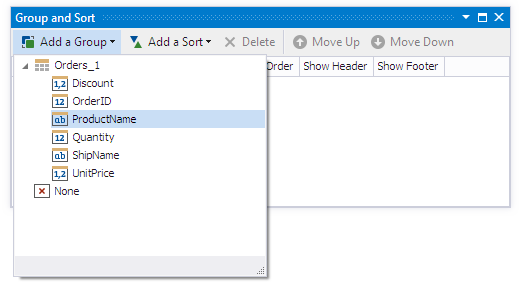
To create a nested group, click Add a Group and select the
ShipNamefield from the menu. Select the Show Footer checkbox in the Group and Sort panel to add the Group Footer band. The resulting Group and Sort panel is shown below: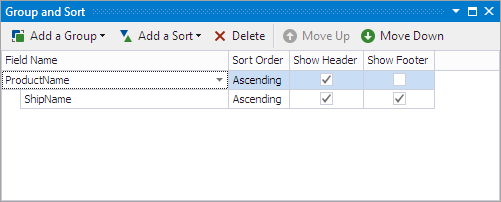
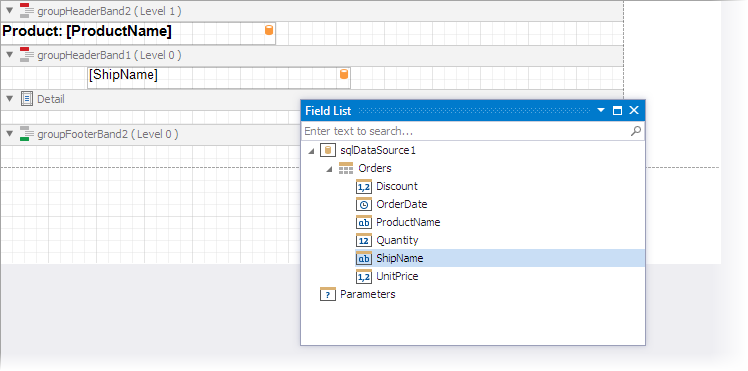
Add Report Controls to Display Data
Drop fields from the Field List window to report bands to create data-bound XRLabel controls that display data:
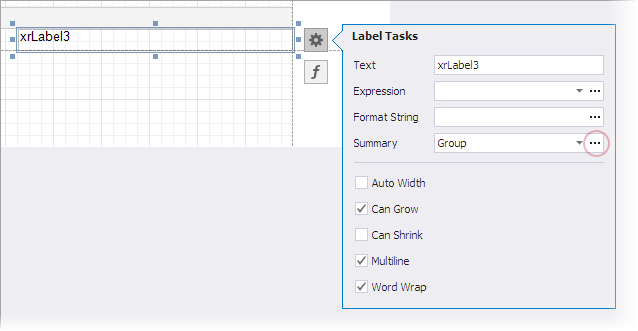
Add a Summary
Drop the XRLabel control from the Toolbox to the Group Footer band. Click the ellipsis next to the Summary editor in the label’s smart tag to invoke the Summary Editor:
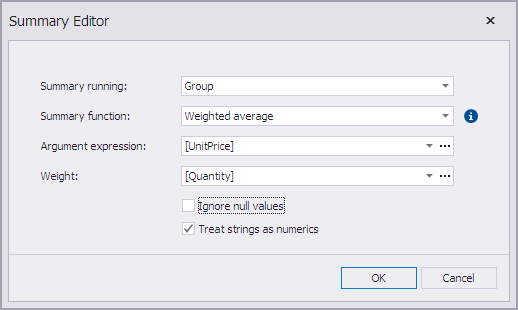
In the Summary Editor dialog you should set the following options:
- Summary running
- Specifies the summary calculation range (the entire report, current report group, or current document page). Select Group from the drop-down list.
- Summary function
- Specifies the summary function. When you hover over the information symbol, it shows a tooltip with information about the selected function. Select Weighted average from the drop-down list.
- Argument expression
- Specifies the data field or an expression that is the summary function argument. Select [UnitPrice].
- Weight
- Specifies the data field or an expression whose value is used in the calculation as a weight for the argument expression. Select [Quantity].
Click OK to close the dialog window.
The Summary Editor settings are automatically converted to an expression that is assigned to the label’s Expression property:

You can specify a format string to indicate summaries in the report.
Click the ellipsis next to the Expression editor to invoke the Expression Editor dialog and adjust the formula as follows:
sumWAvg([UnitPrice]*(1-[Discount]), [Quantity])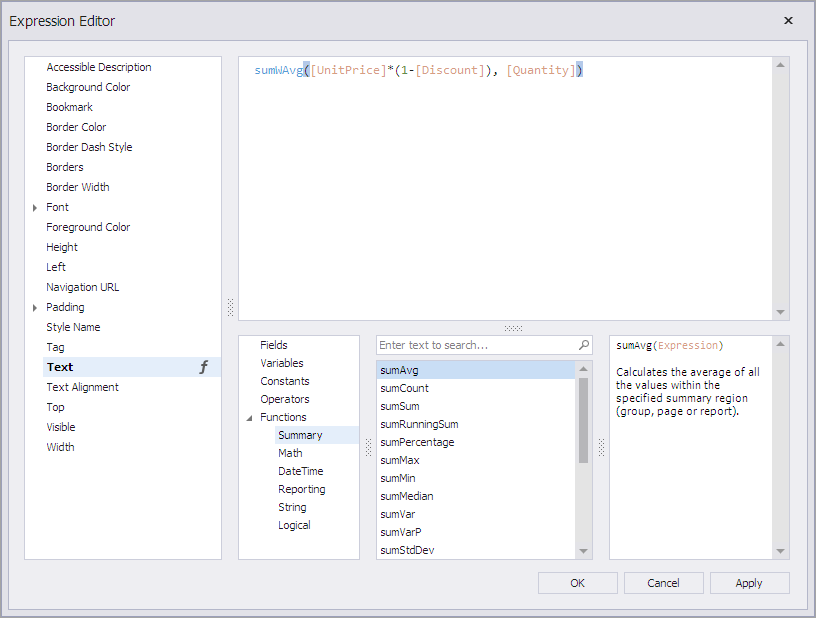
The dialog allows you to edit the summary expression and change the summary function. Review the following topic for a list of supported summary functions: Functions in Expressions.
Click OK to close the dialog window.
Switch to the Preview tab to see the result.