Lesson 5 - Calculate Summaries
- 3 minutes to read
Important
This documentation topic describes legacy technology. We no longer develop new functionality for the Grid
This document contains an overview of the GridControl‘s data summaries and provides an example on how to calculate total and group summaries for orders in the grid created in Lesson 4 of the current Getting Started tutorial.
#Data Summaries Overview
GridControl allows you to display brief information about groups of rows or particular columns. For example, you can display the sum of values or the maximum value, etc. Such information is called a summary.
Two summary types are supported.
Total Summary
An aggregate function value calculated over all rows in a column and displayed under this column.
Group Summaries
An aggregate function value calculated over all rows in a group and displayed in a group row.
Summaries (group and total) are specified by GridColumnSummary objects. You can specify the field against whose values the summary is calculated (GridColumnSummary.FieldName), the aggregate function (GridColumnSummary.Type) and the summary value format (GridColumnSummary.DisplayFormat). Total summaries are stored in the GridControl.TotalSummaries collection. Group summaries are stored in the GridControl.GroupSummaries collection.
Summaries (group and total) provide five predefined aggregate functions.
- Count - the number of data rows.
- Max and Min - the maximum and minimum values.
- Sum and Average - the sum and the average values.
You can also calculate summaries using your own custom rules. To do this, set the GridColumnSummary.Type property to SummaryType.Custom, and handle the GridControl.CalculateCustomSummary event.
#Create Data Summaries - Example
Open the HelloGrid solution created in Lesson 4 of the current Getting Started tutorial and create the following data summaries.
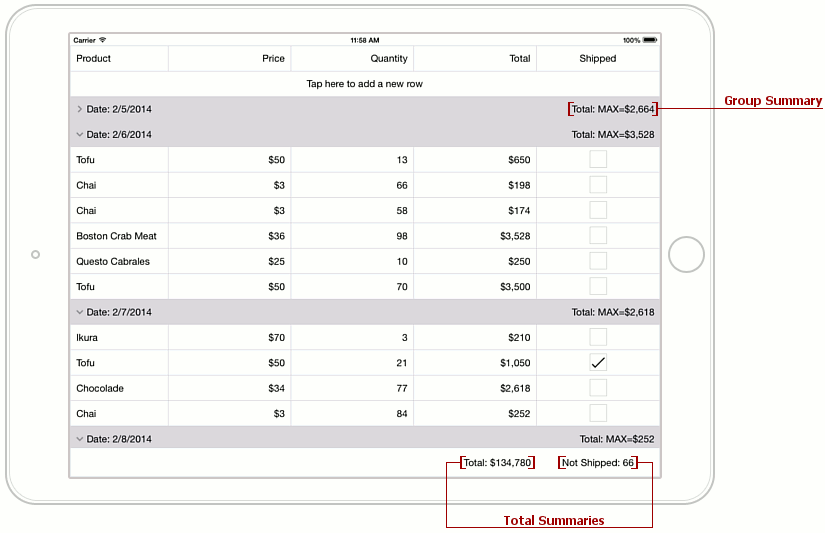
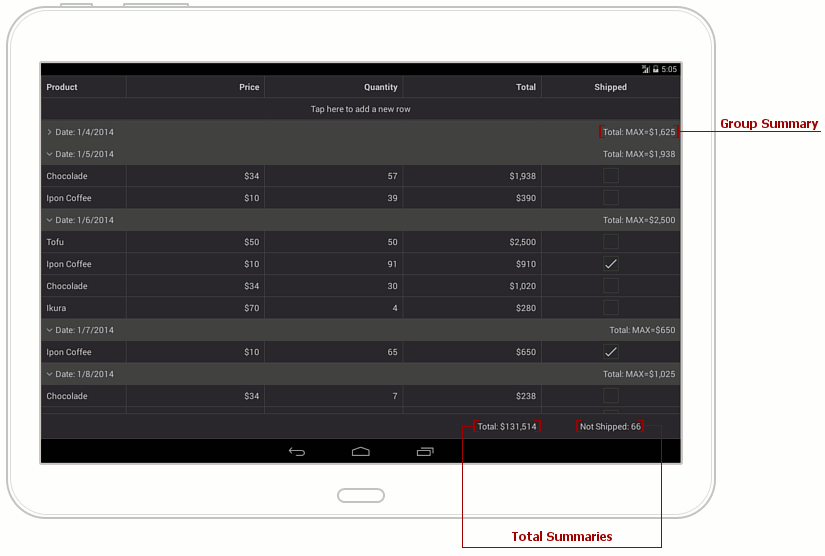
- Group summary to display the maximum Total value for each group of records.
- Total summary to calculate the sum of values by the whole Total column.
- Custom total summary to count a number of orders whose value in the Shipped column is false (to count orders that are not shipped).
You can add data summaries in XAML …
<dxGrid:GridControl x:Name="grid" ItemsSource="{Binding Orders}"
                   NewItemRowVisibility="true"
                    CalculateCustomSummary="OnCalculateCustomSummary">
    <!-- ... -->
    <dxGrid:GridControl.GroupSummaries>
        <dxGrid:GridColumnSummary FieldName="Total" Type="Max"/>
    </dxGrid:GridControl.GroupSummaries>

      <dxGrid:GridControl.TotalSummaries>
          <dxGrid:GridColumnSummary FieldName="Total" Type="Sum"
                                    DisplayFormat= "Total: {0:C0}"/>
          <dxGrid:GridColumnSummary FieldName="Shipped" Type="Custom"
                                    DisplayFormat= "Not Shipped: {0}"/>
      </dxGrid:GridControl.TotalSummaries>
</dxGrid:GridControl>
… or in code.
grid.GroupSummaries.Add (new GridColumnSummary {
    FieldName = "Total",
    Type = SummaryType.Max});

grid.TotalSummaries.Add (new GridColumnSummary () {
    FieldName = "Total",
    Type = SummaryType.Sum,
    DisplayFormat = "Total: {0:C0}"});
As a result, group summaries are displayed in group rows and total summaries are displayed in a total summary panel at the bottom of the grid. The end-user can create or remove a group or total summary by tapping the corresponding item in a menu that appears when they touch and hold a group row or summary panel.
Go on to Lesson 6 of the current Getting Started tutorial to learn how to sort data in the grid.