How to: Bind Individual Chart Series to Data
- 6 minutes to read
This tutorial demonstrates how to bind a chart to an external data source, manually add a series to the chart, and adjust its data bindings. This means that it is possible to provide an individual data source for each series.
To learn how to manually bind a chart’s series to data, do the following.
- Create a Chart and Bind it to Data
- Specify a Series Data Source
- Populate with Data at Design and Runtime
- Customize the Chart
- Get the Result
Create a Chart and Bind it to Data
- Start Microsoft Visual Studio 2012, 2013, 2015, 2017 or 2019 and create a new Windows Forms Application or open an existing one.
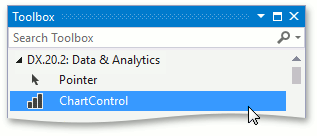
From the DX.19.2: Visualization toolbox tab, drop the ChartControl onto the form.
Note that in this instance the Chart Wizard may be invoked (if its “Show wizard every time a new chart is added” option is enabled). In this example, we don’t need to use the wizard, so click the Cancel button to close the Wizard and manually customize the chart.
Note
For the chart to occupy all the available space on the form, click the chart’s smart tag, and in its actions list, click Dock in parent container.
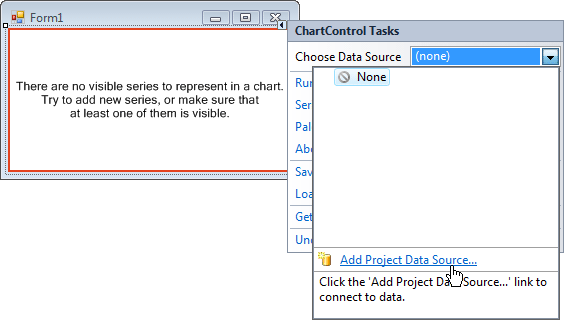
To define a data source for the chart, click its smart tag, and in its actions list, expand the Choose Data Source drop-down list and click on Add Project Data Source… link.
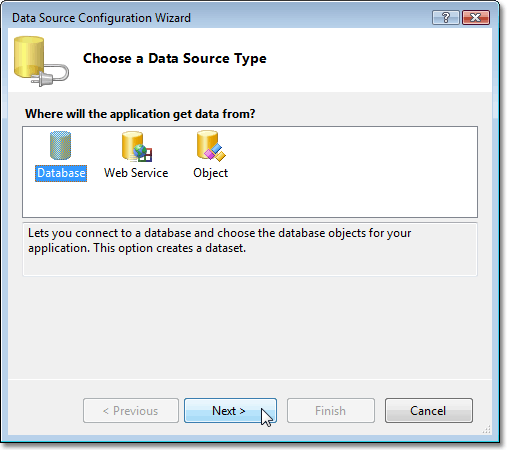
The Data Source Configuration Wizard appears. It allows you to select a data source.
In the Wizard’s first page, select the Database icon and click Next.
On the following page, click New Connection and specify the path to the Northwind database file (leave the Password option blank). Then, you may use the Test Connection option to test data source availability.
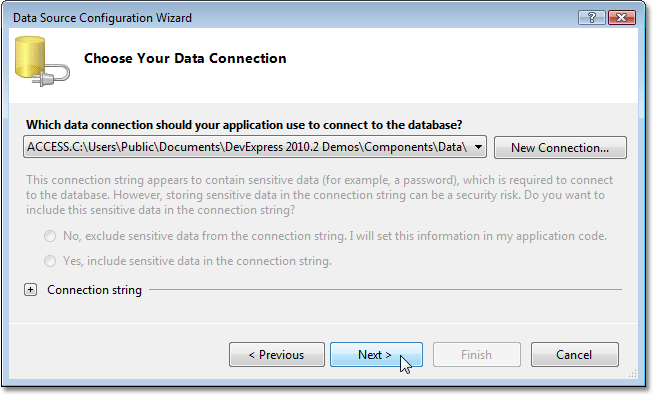
To proceed, click Next.
Note
You can choose between adding the file to your project or leaving it in its original location. For now, select No, as this example is not intended to change database data. For more information on Visual Studio behavior, see the “How to: Manage Local Data Files in Your Project” article in MSDN.
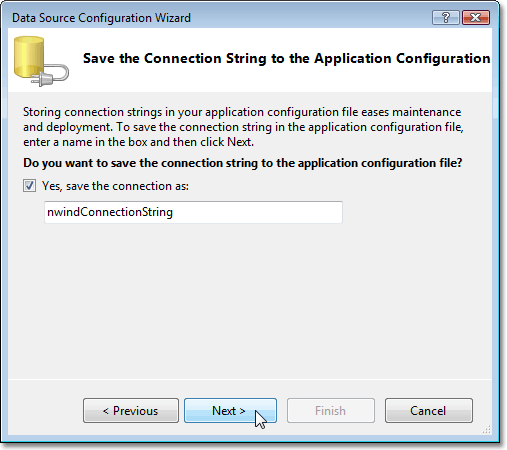
Click Next on the following page, to save the created connection string to the configuration file.
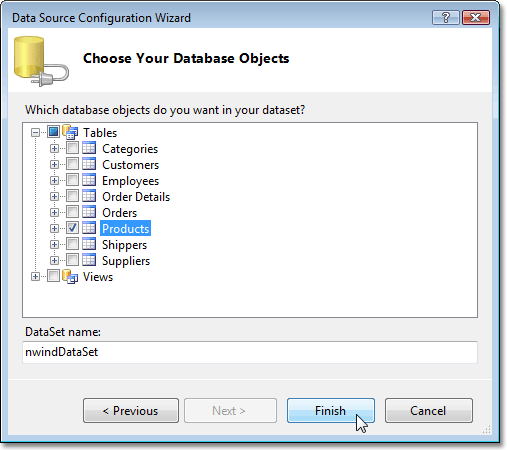
Now, choose the tables or views containing information required for the chart. Select the “Products” table as shown below and click Finish.
As a result, Visual Studio will generate a set of classes for data manipulation within the project. The main ones are:
- nwindDataSet - represents a DataSet object (a collection of tables, relationships, and constraints), which contains the Products table from the Northwind database.
- productsTableAdapter - represents a TableAdapter object, providing communication between the application and a database. Its methods are used for executing queries and stored procedures, fetching data and filling DataTables in DataSets, and sending data back to the database. It is assigned to the ChartControl.DataAdapter property.
- productsBindingSource - represents a BindingSource component, used to simplify the data binding of the nwindDataSet to the ChartControl. It is assigned to the ChartControl.DataSource property.
Now, the chart has been bound to data. The next steps specify which data fields should be used to provide data for the chart’s series.
Specify a Series Data Source
Now, let’s add series to the chart. To do this, click the chart’s smart tag and in its actions list, choose the Series… link.
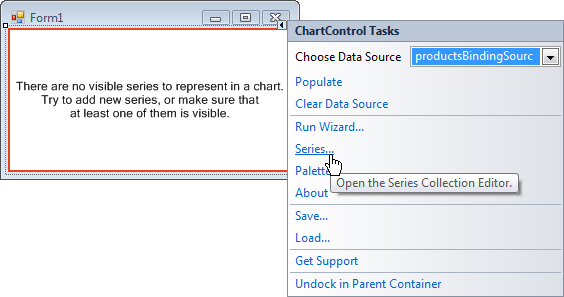
In the invoked Series Collection Editor, click Add…, and select the Bar view.
Note
After you create a series, the chart displays fake data, to give you an idea of what the chart will look like after genuine data is provided.
Now, switch to the Properties tab on the right of the editor’s window and make the following assignments for the Series1 properties.
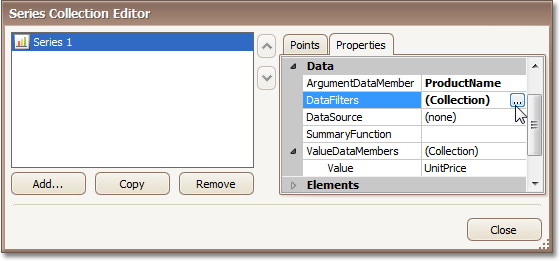
- set the SeriesBase.ArgumentDataMember property to the ProductName data field;
- and, the only value of the SeriesBase.ValueDataMembers property to UnitPrice.
Note
In most scenarios, it is unnecessary to specify the Series.DataSource property.
To limit the number of data points in the series, click the ellipsis button for the SeriesBase.DataFilters property.
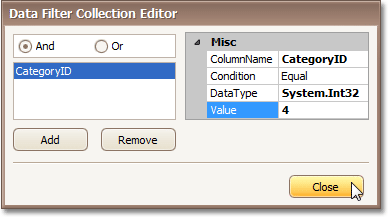
In the invoked Data Filter Collection Editor, click Add, and for the created filtering criterion, set its DataFilter.ColumnName to CategoryID and DataFilter.Value to 4. And leave the DataFilter.Condition property set to its default value (Equal).
Populate with Data at Design and Runtime
If you want to see how the resulting chart will finally look at design time, click its smart tag, and in its actions list, click Populate. This will redraw the chart using obtained data.
At runtime, Visual Studio automatically adds the following code to the form’s Load event, and normally you don’t need to add it manually.
Customize the Chart
Now, you can adjust the following options.
Adjust the X-axis labels.
To prevent lengthy axis labels from overlapping, select the X-axis, and in the Properties window, expand its Axis2D.Label property. Then, set the AxisLabel.Angle property to -35, and enable the TitleBase.EnableAntialiasing property. Alternatively, you can use the AxisLabel.Staggered property.
Adjust the series-view-specific options.
For the created series, it is possible to color each Bar individually. To achieve this, select the series and in the Properties window, expand its SeriesBase.View property. Among the set of the view-type-specific options, locate and enable the SeriesViewColorEachSupportBase.ColorEach property.
Adjust the legend.
For the series, set the SeriesBase.LegendTextPattern property to “{A}{V}”. Now, each data point is represented in the chart’s legend by a separate item, displaying a pair of point arguments and their values. To better position the legend, select it, and in the Properties window, set its Legend.Direction to LeftToRight, Legend.AlignmentHorizontal to Center, and Legend.AlignmentVertical to BottomOutside.
Add a chart title.
To create a title for your chart, select it, and in the Properties window, click the ellipsis button for the ChartControl.Titles property. Then, in the invoked collection editor click Add, and for the created title, set its Title.Text and other options.
Adjust the series point labels.
To hide the series labels, disable the SeriesBase.LabelsVisibility property. Or, you can enable automatic collision detection and resolution for series labels via the SeriesLabelBase.ResolveOverlappingMode property.
Create additional elements.
There are plenty of special elements that you can enable for your charts, such as annotations, trendlines, strips, regression lines and Fibonacci indicators. To produce a clear representation of large amounts of data, you can enable logarithmic axis scaling (via the AxisBase.Logarithmic property), enable scale breaks (via the Axis.ScaleBreaks property), and provide zooming and scrolling capabilities.
Change the chart’s appearance.
To specify a color for series points, use the ChartControl.PaletteBaseColorNumber, ChartControl.PaletteName and ChartControl.AppearanceName properties. For more information on their use, refer to Appearance Customization.
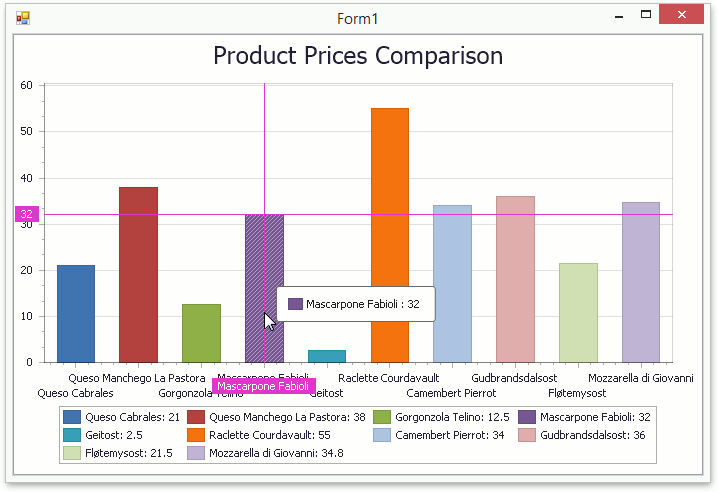
Get the Result
The result is shown in the following image.