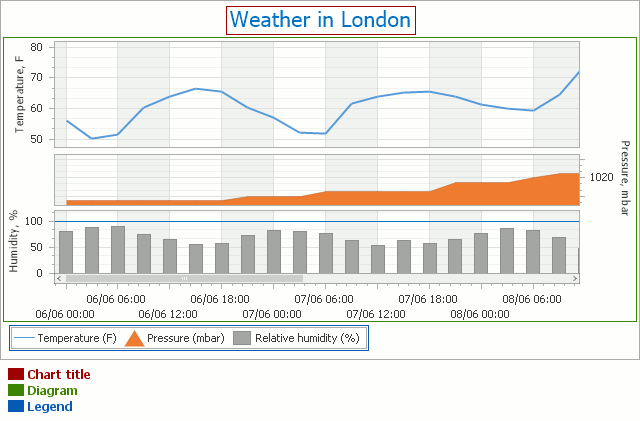
Diagram
- 5 minutes to read
The Diagram is one of the most basic of a chart’s elements, along with chart titles and the legend. Visually, it encloses a chart’s general elements (such as series, panes and axes). To view the WinForms Chart Control architecture schematically, refer to Chart Elements.

The diagram’s most significant characteristic is its type. The type of the diagram depends on the view type of the chart’s series. A diagram of a specific type can only display series of the appropriate view types. And, it’s impossible to plot multiple series of incompatible view types within the same Diagram object (and therefore, within the same chart). And, for each diagram type there is a unique set of available options and elements. For more detailed information on accessing and using diagram objects, refer to Diagram.
The available diagram types fall into the following major categories.
- XY-Diagram
- XY-Diagram 3D
- Swift Plot Diagram
- Simple Diagram
- Simple Diagram 3D
- Funnel Diagram 3D
- Radar and Polar Diagrams
- Gantt Diagram
XY-Diagram
Diagram types of this category are used to plot 2D series - the most popular view types (Bar, Line, etc.).

The table below lists the main properties which affect the element’s appearance and functionality.
Class | |
Availability | The ChartControl.Diagram (XRChart.Diagram) property of a chart control. |
Panes | XYDiagram2D.DefaultPane, XYDiagram2D.Panes, XYDiagram2D.PaneDistance and GridPaneLayout.Direction |
Axes | XYDiagram.AxisX, XYDiagram.AxisY, XYDiagram.SecondaryAxesX and XYDiagram.SecondaryAxesY |
Layout | |
Interactivity | XYDiagram2D.EnableAxisXScrolling, XYDiagram2D.EnableAxisYScrolling, XYDiagram2D.EnableAxisXZooming and XYDiagram2D.EnableAxisYZooming, AxisXBase.StickToEdge, XYDiagram2D.DependentAxesYRange |
To learn more on this diagram category, refer to XY-Diagram.
XY-Diagram 3D
Diagram types of this category provide the functionality for displaying 3D series, the set of which is substantially similar to that of its 2D counterpart (XY-Diagram).

The table below lists the main properties which affect the element’s appearance and functionality.
Class | |
Availability | The ChartControl.Diagram (XRChart.Diagram) property of a chart control. |
Axes | |
Appearance | XYDiagram3D.BackColor, XYDiagram3D.BackImage and XYDiagram3D.FillStyle |
Rotation | Diagram3D.RotationAngleX, Diagram3D.RotationAngleY, Diagram3D.RotationAngleZ, Diagram3D.RotationOrder, Diagram3D.RotationType and Diagram3D.RuntimeRotation |
Scrolling | Diagram3D.HorizontalScrollPercent, Diagram3D.RuntimeScrolling and Diagram3D.VerticalScrollPercent |
Zooming | |
Perspective | |
Size | XYDiagram3D.PlaneDepthFixed, XYDiagram3D.SeriesDistance, XYDiagram3D.SeriesDistanceFixed and XYDiagram3D.SeriesIndentFixed |
To learn more on this diagram category, refer to XY-Diagram 3D.
Swift Plot Diagram
The single diagram type available in this category, provides solely the functionality for displaying the Swift Plot and Swift Point series.

The table below lists the main properties which affect the element’s appearance and functionality.
Class | |
Availability | The ChartControl.Diagram (XRChart.Diagram) property of a chart control. |
Axes | SwiftPlotDiagramAxisX, SwiftPlotDiagramAxisY, SwiftPlotDiagramSecondaryAxisX and SwiftPlotDiagramSecondaryAxisY |
Appearance | SwiftPlotSeriesView.Antialiasing, DrawOptions.Color and SwiftPlotDrawOptions.LineStyle |
Interactivity | XYDiagram2D.EnableAxisXScrolling, XYDiagram2D.EnableAxisYScrolling, XYDiagram2D.EnableAxisXZooming and XYDiagram2D.EnableAxisYZooming, SwiftPlotDiagramAxisXBase.StickToEdge, XYDiagram2D.DependentAxesYRange |
In most other aspects, the options available for the Swift Plot Diagram type are similar to that of the XY-Diagram type.
To learn more on this diagram category, refer to Swift Plot Diagram.
Simple Diagram
Diagram types of this category provide the functionality for displaying 2D Pie, Doughnut and Funnel series.

The table below lists the main properties which affect the element’s appearance and functionality.
Class | |
Availability | The ChartControl.Diagram (XRChart.Diagram) property of a chart control. |
Layout | SimpleDiagram.Dimension, SimpleDiagram.LayoutDirection and SimpleDiagram.Margins. |
To learn more on this diagram category, refer to Simple Diagram.
Simple Diagram 3D
Diagram types of this category provide the functionality for displaying 3D Pie, Doughnut and Funnel series.

The table below lists the main properties which affect the element’s appearance and functionality.
Class | |
Availability | The ChartControl.Diagram (XRChart.Diagram) property of a chart control. |
Rotation | Diagram3D.RotationAngleX, Diagram3D.RotationAngleY, Diagram3D.RotationAngleZ, Diagram3D.RotationOrder, Diagram3D.RotationType and Diagram3D.RuntimeRotation |
Scrolling | Diagram3D.HorizontalScrollPercent, Diagram3D.RuntimeScrolling and Diagram3D.VerticalScrollPercent |
Zooming | |
Perspective | |
Layout | SimpleDiagram3D.Dimension and SimpleDiagram3D.LayoutDirection |
To learn more on this diagram category, refer to Simple Diagram 3D.
Funnel Diagram 3D
The single diagram type available in this category is only intended to plot series of the Funnel 3D view type. The functionality provided by this diagram type is identical to that of the Simple Diagram 3D, except that it has different default rotation angle values.

The table below lists the main properties which affect the element’s appearance and functionality.
Class | |
Availability | The ChartControl.Diagram (XRChart.Diagram) property of a chart control. |
To learn more on this diagram category, refer to Funnel Diagram 3D.
Radar and Polar Diagrams
Diagram types of this category are used to plot Radar and Polar series.

The table below lists the main properties which affect the element’s appearance and functionality.
Class | |
Availability | The ChartControl.Diagram (XRChart.Diagram) property of a chart control. |
Axes | |
Appearance | RadarDiagram.BackColor, RadarDiagram.BackImage, RadarDiagram.BorderColor, RadarDiagram.BorderVisible, RadarDiagram.DrawingStyle, RadarDiagram.FillStyle and RadarDiagram.Shadow |
Layout | RadarDiagram.Margins, RadarDiagram.RotationDirection and RadarDiagram.StartAngleInDegrees |
To learn more on this diagram category, refer to Radar and Polar Diagrams.
Gantt Diagram
The only diagram type available in this category is used to exclusively plot series of the Gantt view type. This diagram type is similar in almost every respect to the XY-Diagram, with the only exception being the GanttDiagram.Rotated property, which is always true and hidden.

To learn more on this diagram category, refer to Gantt Diagram.