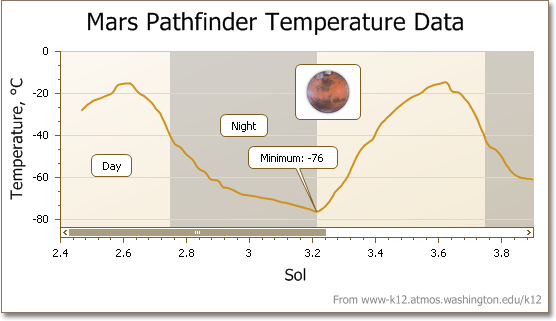
Annotation
An annotation is a comment with information about a chart’s content. The Chart Control supports text and image annotations. You can add annotations for a chart, pane, or series point.

The ChartControl.AnnotationRepository property contains all annotations specified for different chart elements. You can also obtain an annotation in the anchor element’s collection: ChartControl.Annotations, XYDiagramPaneBase.Annotations, SeriesPoint.Annotations. See the Anchor Point section of the Annotations help topic for more information.
You can position an annotation absolutely or relatively. Refer to the Annotation Position section of the Annotations help topic for details on how to position annotations.
This table lists the main properties that specify an annotation’s appearance and functionality:
Class | |
Availability | ChartControl.AnnotationRepository, ChartControl.Annotations, XYDiagramPaneBase.Annotations, and SeriesPoint.Annotations |
Layout and Position | Annotation.AnchorPoint, Annotation.ShapePosition, Annotation.LabelMode,Annotation.ZOrder, and Annotation.Angle. |
Interactivity | Annotation.RuntimeAnchoring, Annotation.RuntimeMoving, Annotation.RuntimeResizing, Annotation.RuntimeRotation, and Annotation.RuntimeEditing |
Appearance | Annotation.ShapeFillet, Annotation.ShapeKind, ImageAnnotation.SizeMode, and TextAnnotation.AutoSize |