Summaries Overview
- 2 minutes to read
PivotGrid’s cells display the results of summaries calculated against data fields. Pivot Grid Control supports both automatic and custom summaries. Automatic summaries are always calculated against data fields, while custom summaries can be calculated against any field (including data fields) or multiple fields at the same time.
Summaries are calculated for a subset of records from the control’s underlying data source. Subset records have the same column field and row field values, displayed in column and row headers.
Summary values are displayed in cells in the data area. The following Pivot Grid Control contains two data fields: Sales and Qty.
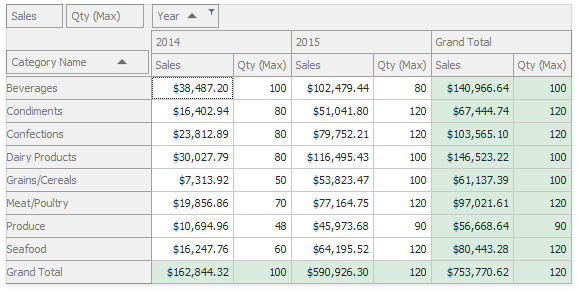
The summary value in the left-topmost cell ($38,487.20) is calculated for the Product Sales field values in a subset of records that have the following:
- the ‘Beverages’ value in the Category Name field
- the ‘2014’ value in the Year field
The summary value in the bottommost cell in the second column (100) is calculated for the Qty field in a subset of records that have the following:
- the ‘2014’ value in the Year field
Use the PivotGridFieldBase.SummaryType property to specify the type of the summary function. You can use the PivotGridFieldOptions.AllowRunTimeSummaryChange property to enable the data field’s summary change menu to allow the users to change the summary type at runtime.
For information on how to obtain summary values, refer to the Accessing Cell Values topic.
For information on how to display correlations between different summary values, instead of displaying raw summaries, see the Summary Display Modes topic.