Custom Summaries
- 7 minutes to read
Custom summaries allow you to calculate summaries at your discretion. Custom summaries can do the following:
- calculate a custom summary function;
- involve multiple fields in summary calculation;
- calculate a summary for records that match certain criteria.
Do the following in Optimized mode:
- Create an additional field.
- To display totals only, set the PivotGridField.Options.ShowValues property to false.
- Specify an expression to calculate. Set the field’s DataBinding property to the ExpressionDataBinding instance with the proper Expression string.
- Add the field to the Data Area.
The Pivot Grid control in Legacy and LegacyOptimized mode (before v19.2) can handle the PivotGridControl.CustomSummary event to implement a custom summary calculation routine. This approach can potentially degrade the performance.
Tip
In a custom summary calculation requires SELECT (to select from additional data sources) or JOIN operations, you can create a FederationDataSource and bind it to the Pivot Grid fields.
Examples
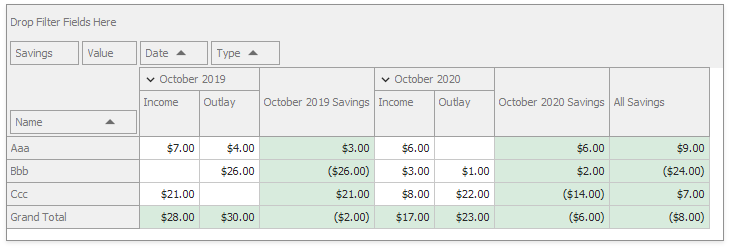
This example calculates and displays the difference between Income and Outlay in totals.
It demostrates the following approaches:
- Legacy approach that is based on a CustomSummary event. This approach does not work in Optimized mode.
- Unbound field. This approach uses a summary expression in an additional unbound field .
- Data Binding API. This approach works only in Optimized mode. An additional field uses the ExpressionDataBinding instance to specify an expression to calculate.
The image below shows the result.
For more information on custom summaries, refer to the Custom Summaries topic.
Note
The complete sample project How to Calculate and Display Custom Summaries is available in the DevExpress Examples repository.
using DevExpress.XtraPivotGrid;
using System;
using System.Linq;

namespace PivotGridCustomSummaryExample
{
    public partial class Form1 : DevExpress.XtraEditors.XtraForm
    {
        public Form1()
        {
            InitializeComponent();
            SelectCustomSummaryApproach(pivotGridControl1.OptionsData.DataProcessingEngine);
            pivotGridControl1.FieldValueDisplayText += PivotGridControl1_FieldValueDisplayText;
            pivotGridControl1.DataSource = TestData.GetData();
            pivotGridControl1.BestFit();
        }
        private void SelectCustomSummaryApproach(PivotDataProcessingEngine dataProcessingEngine)
        {
            switch (dataProcessingEngine)
            {
                case PivotDataProcessingEngine.Optimized:
                    UseOptimizedApproach();
                    break;
                case PivotDataProcessingEngine.LegacyOptimized:
                    UseUnboundExpressionApproach();
                    break;
                default:
                    UseLegacyApproach();
                    break;
            }
        }

        private void toggleOptimizedMode_Toggled(object sender, EventArgs e)
        {
            if (((DevExpress.XtraEditors.ToggleSwitch)sender).IsOn) {
                MigrateToOptimizedMode();
                pivotGridControl1.OptionsData.DataProcessingEngine = PivotDataProcessingEngine.Optimized;
                SelectCustomSummaryApproach(PivotDataProcessingEngine.Optimized);
            }
            else {
                pivotGridControl1.OptionsData.DataProcessingEngine = PivotDataProcessingEngine.LegacyOptimized;
                SelectCustomSummaryApproach(PivotDataProcessingEngine.LegacyOptimized);
            };
        }
        private void UseLegacyApproach()
        {
            pivotGridControl1.Fields["Value"].SummaryType = DevExpress.Data.PivotGrid.PivotSummaryType.Custom;
            pivotGridControl1.CustomSummary += pivotGridControl1_CustomSummary;
        }
        // The CustomSummary event is a legacy approach.
        private void pivotGridControl1_CustomSummary(object sender, PivotGridCustomSummaryEventArgs e)
        {
            if (e.DataField.Name == "fieldValue")
            {
                if (CustomSummaryHelper.ShouldCalculateCustomValue(fieldType, e))
                {
                    var groupedDataSource =
                        e.CreateDrillDownDataSource().Cast<PivotDrillDownDataRow>().GroupBy(r => r[fieldType]);
                    decimal incomeSummary = CustomSummaryHelper.GetGroupSummary(groupedDataSource, "Income", e.FieldName);
                    decimal outlaySummary = CustomSummaryHelper.GetGroupSummary(groupedDataSource, "Outlay", e.FieldName);
                    e.CustomValue = incomeSummary - outlaySummary;
                }
                else
                    e.CustomValue = e.SummaryValue.Summary;
            }
        }
        private void UseUnboundExpressionApproach()
        {
            // Hide totals for the Value field.
            pivotGridControl1.Fields["Value"].Options.ShowTotals = false;
            pivotGridControl1.Fields["Value"].Options.ShowGrandTotal = false;
            // Create a new field to display totals.
            PivotGridField fieldValueTotal = pivotGridControl1.Fields.GetFieldByName("fieldValueTotal") ?? CreateSavingsField();
            fieldValueTotal.UnboundExpression = "Sum(Iif([Type]='Income', [Value], -[Value]))";
            fieldValueTotal.UnboundType = DevExpress.Data.UnboundColumnType.Decimal;
            fieldValueTotal.UnboundExpressionMode = UnboundExpressionMode.UseAggregateFunctions;
        }
        private void UseOptimizedApproach()
        {
            // Hide totals for the Value field.
            pivotGridControl1.Fields["Value"].Options.ShowTotals = false;
            pivotGridControl1.Fields["Value"].Options.ShowGrandTotal = false;
            // Create a new field to display totals.
            PivotGridField fieldValueTotal = pivotGridControl1.Fields.GetFieldByName("fieldValueTotal") ?? CreateSavingsField();
            ExpressionDataBinding savingsBinding = new ExpressionDataBinding("Sum(Iif([Type]='Income', [Value], -[Value]))");
            fieldValueTotal.DataBinding = savingsBinding;
        }

        private PivotGridField CreateSavingsField()
        {
            // Add a new field to calculate custom totals.
            PivotGridField fieldValueTotal = new PivotGridField
            {
                Area = DevExpress.XtraPivotGrid.PivotArea.DataArea,
                AreaIndex = 0,
                Caption = "Savings",
                FieldName = "Savings",
                Name = "fieldValueTotal"
            };
            fieldValueTotal.Options.ShowValues = false;
            pivotGridControl1.Fields.Add(fieldValueTotal);
            return fieldValueTotal;
        }
        private void PivotGridControl1_FieldValueDisplayText(object sender, PivotFieldDisplayTextEventArgs e)
        {
            if (e.ValueType == PivotGridValueType.GrandTotal)
            {
                if (e.IsColumn)
                    e.DisplayText = "All Savings";
            }
            if (e.ValueType == PivotGridValueType.Total)
                if (e.IsColumn)
                    e.DisplayText = e.DisplayText.Replace("Total", "Savings");

        }
        private void MigrateToOptimizedMode()
        {
            pivotGridControl1.Fields["Value"].SummaryType = DevExpress.Data.PivotGrid.PivotSummaryType.Sum;
            pivotGridControl1.CustomSummary -= pivotGridControl1_CustomSummary;
        }
    }
}
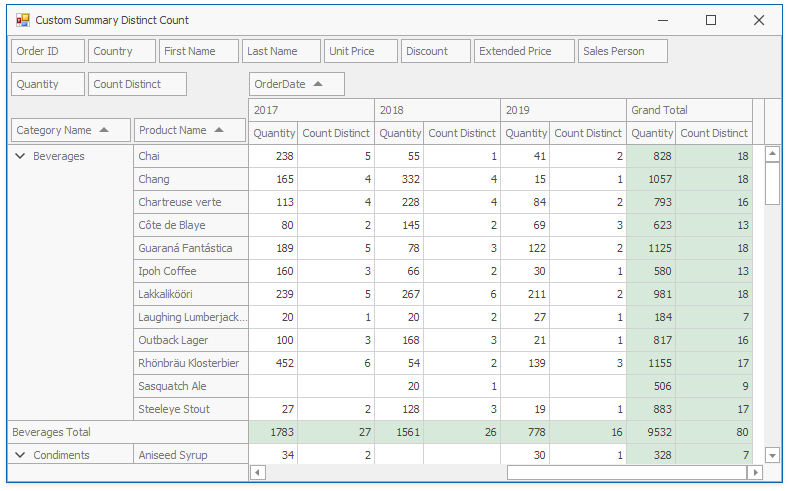
This example demonstrates how to calculate a custom summary to display the distinct value count.
When the control calculates the summary value for the field whose SummaryType is PivotSummaryType.Custom, the PivotGridControl.CustomSummary event occurs. The event handler calls the e.CreateDrillDownDataSource method to retrieve the underlying data rows for the current cell, counts distinct values and returns the result to the e.CustomValue property.
Note
The complete sample project How to Create a Custom Summary Type to Display the Distinct Value Count is available in the DevExpress Examples repository.
using DevExpress.XtraEditors;
using DevExpress.XtraPivotGrid;
using System;
using System.Collections;

namespace CustomSummaryDistinctCountExample
{
    public partial class Form1 : XtraForm
    {
        public Form1()
        {
            InitializeComponent();
            AddCustomSummaryField();
            pivotGridControl1.CustomSummary += PivotGridControl1_CustomSummary;
            pivotGridControl1.BestFit();
        }

        private void AddCustomSummaryField()
        {
            pivotGridControl1.Fields.Add(new PivotGridField()
            {
                Area = PivotArea.DataArea,
                AreaIndex = 1,
                Caption = "Count Distinct ",
                FieldName = "Quantity",
                Name = "fieldQuantityDistinctCount",
                SummaryType = DevExpress.Data.PivotGrid.PivotSummaryType.Custom
            });
        }

        private void Form1_Load(object sender, EventArgs e)
        {
            excelDataSource1.FileName = "SalesPerson.xlsx";
            excelDataSource1.Fill();
        }

        private void PivotGridControl1_CustomSummary(object sender, PivotGridCustomSummaryEventArgs e)
        {
            string name = e.DataField.FieldName;

            IList list = e.CreateDrillDownDataSource();
            Hashtable ht = new Hashtable();
            for (int i = 0; i < list.Count; i++)
            {
                PivotDrillDownDataRow row = list[i] as PivotDrillDownDataRow;
                object v = row[name];
                if (v != null && v != DBNull.Value)
                    ht[v] = null;
            }
            e.CustomValue = ht.Count;
        }
    }
}
Note
Custom summaries calculated using the PivotGridControl.CustomSummary event are not supported in server and OLAP modes.