Series.Data Property
Gets or sets an object that defines how data should be supplied for this series.
Namespace: DevExpress.WinUI.Charts
Assembly: DevExpress.WinUI.Charts.v22.1.dll
NuGet Package: DevExpress.WinUI
Declaration
Property Value
| Type |
|---|
| DataSourceBase |
Remarks
For more information, refer to Providing Data.
Example
The following example demonstrates how to bind a chart to data from a ViewModel.
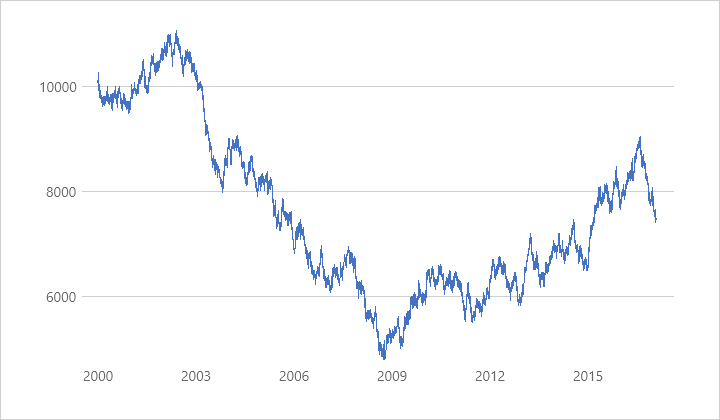
To do this, it is necessary to assign the DataSource object to the Series.Data property and specify the data source for the adapter in its DataSource.PointSource property.
<Window
    x:Class="DataSourceExample.MainWindow"
    xmlns="http://schemas.microsoft.com/winfx/2006/xaml/presentation"
    xmlns:x="http://schemas.microsoft.com/winfx/2006/xaml"
    xmlns:local="using:DataSourceExample"
    xmlns:d="http://schemas.microsoft.com/expression/blend/2008"
    xmlns:mc="http://schemas.openxmlformats.org/markup-compatibility/2006"
    xmlns:Charts="using:DevExpress.WinUI.Charts"
    mc:Ignorable="d">

    <Grid>
        <Charts:CartesianChart x:Name="chart">
            <Charts:Series>
                <Charts:Series.View>
                    <Charts:LineSeriesView/>
                </Charts:Series.View>
                <Charts:Series.Data>
                    <Charts:DataSource PointSource="{Binding ItemsSource}"
                                       ArgumentDataMember="PointArgument"
                                       ValueDataMember="PointValue"/>
                </Charts:Series.Data>
            </Charts:Series>
            <Charts:CartesianChart.AxisX>
                <Charts:AxisX DateTimeGridAlignment="Year"
                              DateTimeMeasureUnit="Hour"
                              LabelPattern="{}{V:yyyy}"/>
            </Charts:CartesianChart.AxisX>
        </Charts:CartesianChart>
    </Grid>
</Window>
using Microsoft.UI.Xaml;
using System;
using System.Collections;
using System.Collections.Generic;

namespace DataSourceExample {

    public sealed partial class MainWindow : Window {
        public MainWindow() {
            this.InitializeComponent();
            chart.DataContext = new ViewModel() {
                Start = 10000,
                Count = 50000,
                Step = TimeSpan.FromHours(3),
            };
        }
    }
    public class DateTimeDataPoint {
        public DateTime PointArgument { get; set; }
        public double PointValue { get; set; }
    }

    public class ViewModel {
        DateTime start = new DateTime(2000, 1, 1);
        IEnumerable itemsSource;
        readonly Random random = new Random();


        public TimeSpan Step { get; set; }
        public int Count { get; set; }
        public double Start { get; set; }
        public IEnumerable ItemsSource {
            get { return itemsSource ??= CreateItemsSource(Count); }
        }

        protected IEnumerable CreateItemsSource(int count) {
            var points = new List<DateTimeDataPoint>();

            double value = GenerateStartValue(random);
            points.Add(new DateTimeDataPoint() { PointArgument = start, PointValue = value });
            for (int i = 1; i < count; i++) {
                value += GenerateAddition(random);
                start += Step;
                points.Add(new DateTimeDataPoint() { PointArgument = start, PointValue = value });
            }
            return points;
        }

        protected double GenerateStartValue(Random random) {
            return Start + random.NextDouble() * 100;
        }

        protected double GenerateAddition(Random random) {
            double factor = random.NextDouble();
            if (factor == 1)
                factor = 50;
            else if (factor == 0)
                factor = -50;
            return (factor - 0.5) * 50;
        }
    }
}
See Also