AxisBase.GridSpacing Property
Gets or sets the interval between axis gridlines.
Namespace: DevExpress.WinUI.Charts
Assembly: DevExpress.WinUI.Charts.v22.1.dll
NuGet Package: DevExpress.WinUI
Declaration
Property Value
| Type | Description |
|---|---|
| Double | The interval between axis gridlines. |
Remarks
An axis is divided into intervals. Grid lines, tickmarks, and axis labels mark interval boundaries. The GridSpacing property allows you to specify the frequency of axis interval marks. For date-time axes, the AxisBase.DateTimeGridAlignment property specifies the interval dimension.
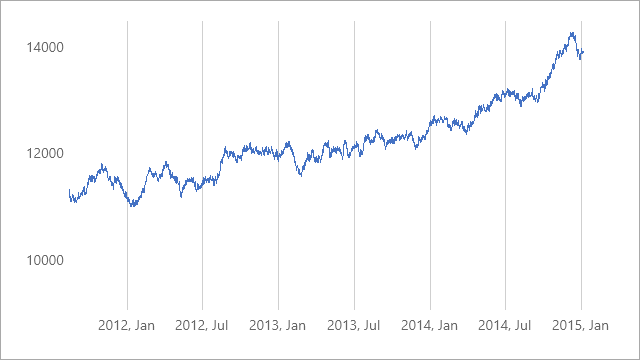
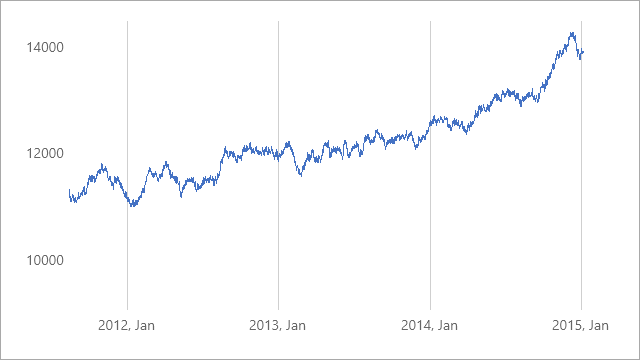
The following images show a chart with different GridSpacing values set for the x-axis. For example, when GridSpacing is set to 6, each sixth grid line and axis label is shown:
| GridSpacing = 6 | GridSpacing = 12 |
|---|---|
 |
 |
Before you set the GridSpacing property, disable the AxisBase.GridSpacingAuto property.
<Charts:CartesianChart.AxisX>
    <Charts:AxisX x:Name="axisX"
                  DateTimeGridAlignment="Month"
                  DateTimeMeasureUnit="Hour"
                  GridSpacing="12"
                  GridSpacingAuto="False"
                  ShowMajorGridlines="True"
                  LabelPattern="{}{V:yyyy, MMM}"/>
    </Charts:AxisX>
</Charts:CartesianChart.AxisX>