Charts Gallery
- 4 minutes to read
DevExpress WinUI Charts ship with three chart controls (CartesianChart, PieChart, and FunnelChart) that support different series views. This topic lists series views available in DevExpress WinUI Charts.
Cartesian Chart
Bar (Column) Series Views
The CartesianChart can display bar series (BarSeriesView) that you can use to create the following charts:
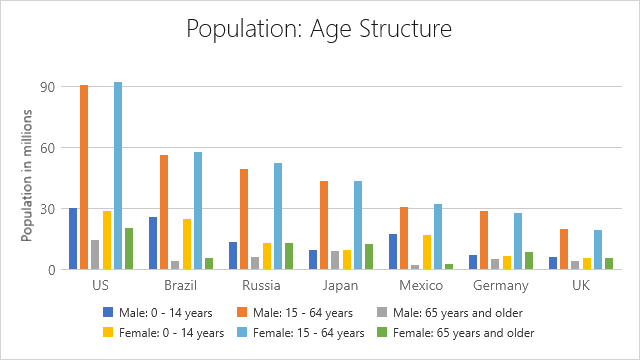
Side-by-Side Bar Chart
Initialize the Series.View property with a BarSeriesView object to visualize data points as bars:
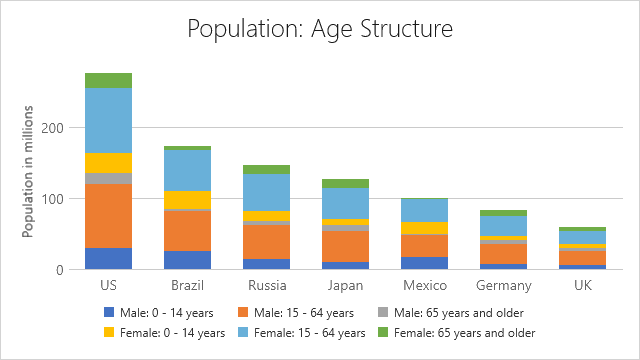
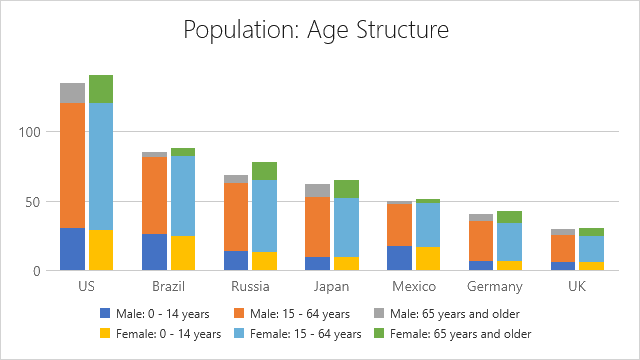
Stacked Bar Chart
Initialize the Series.View property with a BarSeriesView object. Then, set the BarSeriesView.StackedMode property to Stacked to display bars as stacked:
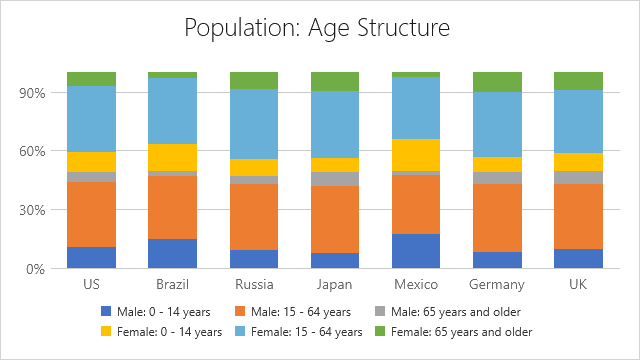
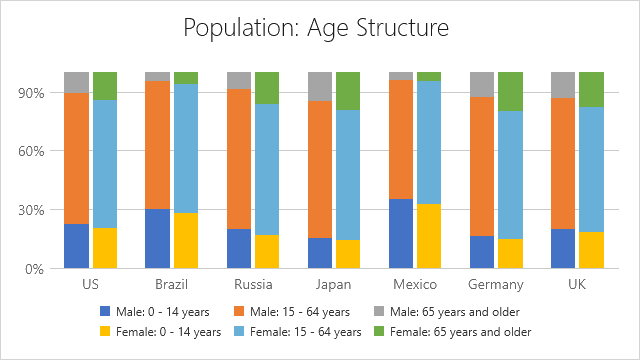
Full-Stacked Bar Chart
Initialize the Series.View property with a BarSeriesView object. Then, set the BarSeriesView.StackedMode property to FullStacked to display data points as full-stacked bars:
Side-by-Side Stacked Bar Chart
Initialize the Series.View property with a BarSeriesView object. Then, set theBarSeriesView.StackedMode property to Stacked to display bars stacked. Use the BarSeriesView.StackedGroup property to specify to which group a stacked bar series belongs.
Side-by-Side Full-Stacked Bar Chart
Initialize the Series.View property with a BarSeriesView object. Then, set the BarSeriesView.StackedMode property to FullStacked to display data points as full-stacked bars. Use the BarSeriesView.StackedGroup property to specify to which group a stacked bar series belongs.
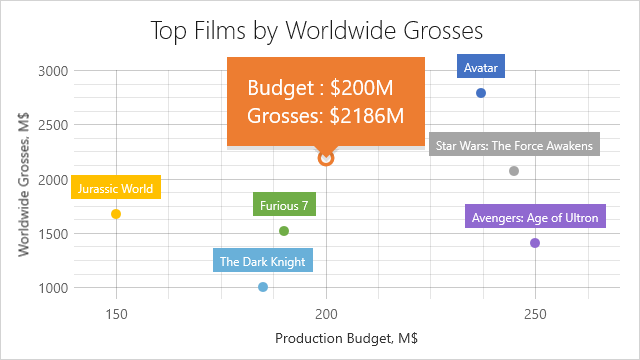
Point Series View
The CartesianChart can display point series. Initialize the Series.View property with a PointSeriesView object to display data points in the following way:
Line Series Views
The CartesianChart can display line series (LineSeriesView and ScatterLineSeriesView) that you can use to create the following charts:
Line Chart
Initialize the Series.View property with a LineSeriesView object to visualize data points as lines:

Step Line Chart
Initialize the Series.View property with a LineSeriesView object. Set the LineSeriesView.InterpolationMode property to Step to draw a stepped line series:

Stacked Line Chart
Initialize the Series.View property with a LineSeriesView object. Set LineSeriesView.StackedMode to Stacked to display multiple lines stacked:

Stacked Step Line Chart
Initialize the Series.View property with a LineSeriesView object. To create a stacked line chart, set the LineSeriesView.InterpolationMode property to Step and the LineSeriesView.StackedMode property to Stacked:

Full-Stacked Line Chart
Initialize the Series.View property with a LineSeriesView object. Set the LineSeriesView.StackedMode property to FullStacked to display multiple series as full-stacked lines:

Full-Stacked Step Line Chart
Initialize the Series.View property with a LineSeriesView object. To create a full-stacked step line chart, set the LineSeriesView.InterpolationMode property to Step and the LineSeriesView.StackedMode property to FullStacked.

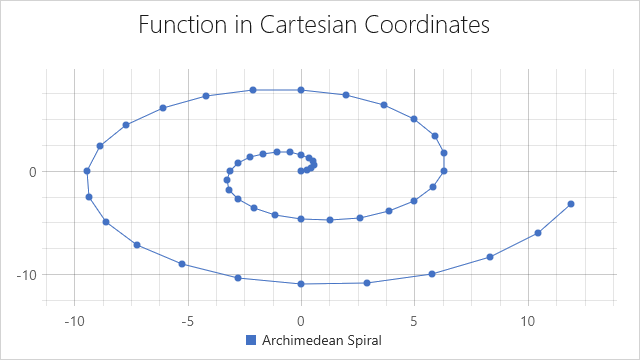
Scatter Line Chart
Initialize the Series.View property with a ScatterLineSeriesView object if you want to connect data points in the order they have in the data source:
Area Series Views
The CartesianChart can display area series (AreaSeriesView) that you can use to create the following charts:
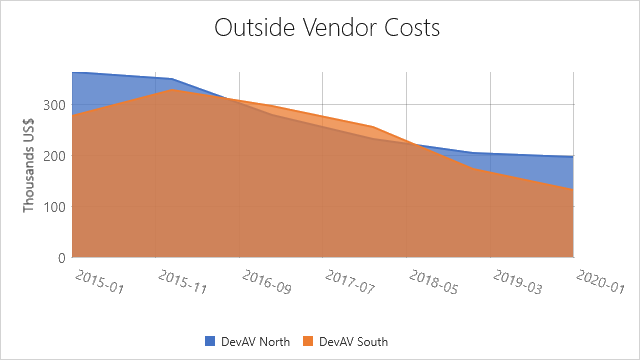
Area Chart
Initialize the Series.View property with an AreaSeriesView object to display data points as filled areas:
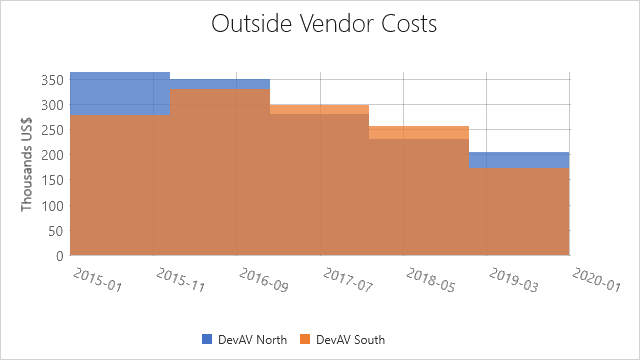
Step Area Chart
Initialize the Series.View property with an AreaSeriesView object. Then, set the AreaSeriesView.InterpolationMode property to Step to draw a stepped area series:
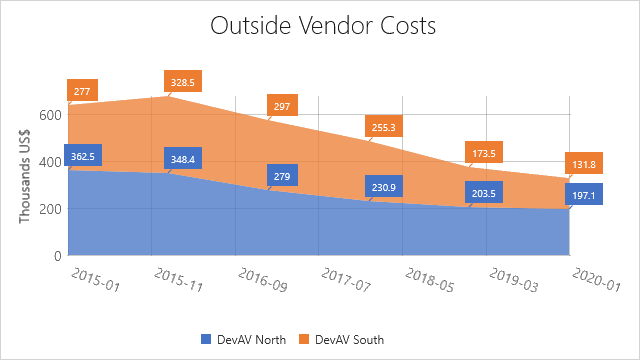
Stacked Area Chart
Initialize the Series.View property with an AreaSeriesView object. Set the AreaSeriesView.StackedMode property to Stacked to display multiple area series stacked:
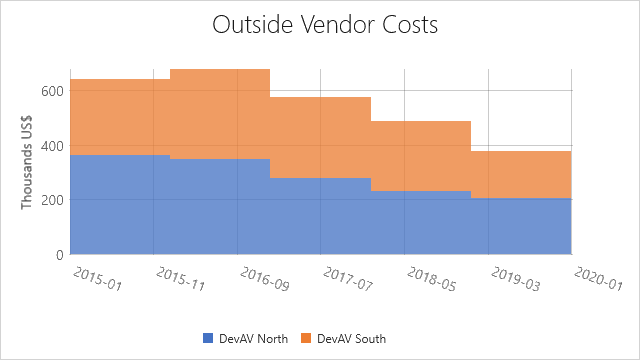
Stacked Step Area Chart
Initialize the Series.View property with an AreaSeriesView object. To create a stacked step area chart, set the AreaSeriesView.InterpolationMode property to Step and the AreaSeriesView.StackedMode property to Stacked:
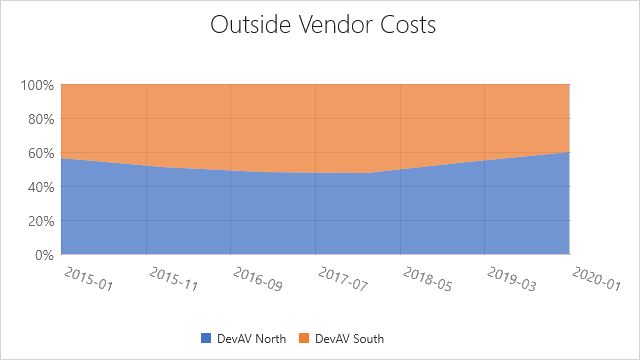
Full-Stacked Area Chart
Initialize the Series.View property with an AreaSeriesView object. Set the AreaSeriesView.StackedMode property to FullStacked to display multiple series as full-stacked area series:
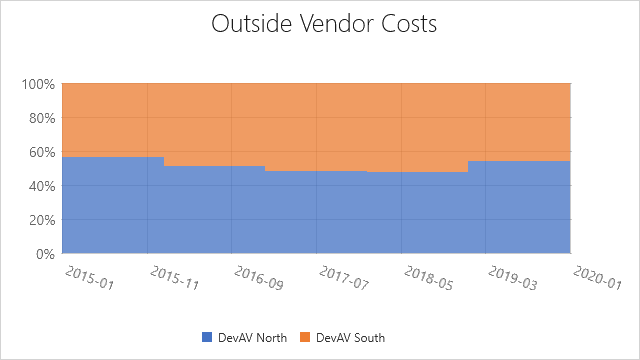
Full-Stacked Step Area Chart
Initialize the Series.View property with an AreaSeriesView object. Set the LineSeriesView.InterpolationMode property to Step and the LineSeriesView.StackedMode property to FullStacked to display multiple series as full-stacked step area series:
Pie Chart
The PieChart can display pie series (PieSeriesView) that you can use to create the following charts:
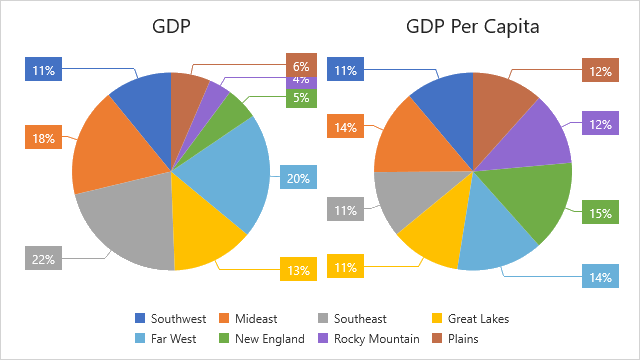
Pie
Initialize the PieSeries.View property with a PieSeriesView object to data points as pie slices:
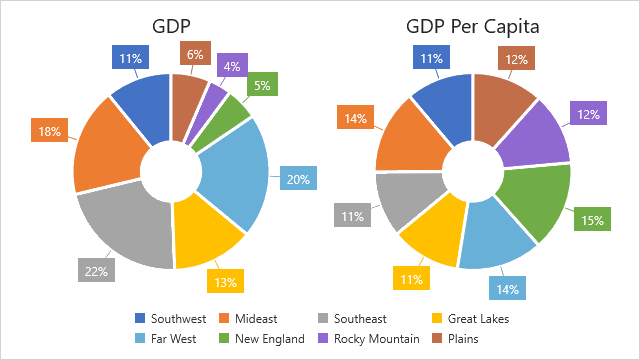
Donut
Initialize the PieSeries.View property with a PieSeriesView object. Then, enable the PieSeriesView.ShowDonut property to show a pie series as a donut:
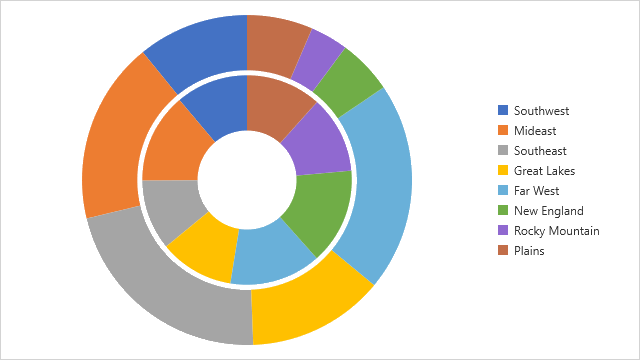
Nested Donut
Initialize the PieSeries.View property with a PieSeriesView object. Then, enable the PieSeriesView.ShowDonut property to show a pie as a donut and specify the PieSeriesView.DonutGroup property to define how to group donuts.
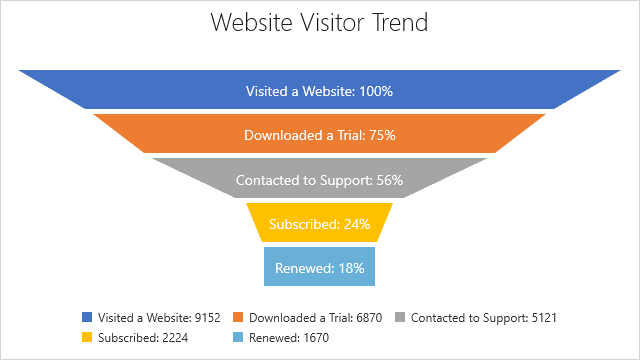
Funnel Chart
The FunnelChart can display funnel series. Initialize the Series.View property with a FunnelSeriesView object to display data points as a funnel: