BarSeriesView.StackedMode Property
Specifies whether bars are stacked when shown for the same argument.
Namespace: DevExpress.WinUI.Charts
Assembly: DevExpress.WinUI.Charts.v22.1.dll
NuGet Package: DevExpress.WinUI
Declaration
[DP(StackedMode.None, Handler = "ViewTypeChanged")]
public StackedMode StackedMode { get; set; }Property Value
| Type | Description |
|---|---|
| StackedMode | A value that defines how bars are stacked. |
Available values:
| Name | Description | Image |
|---|---|---|
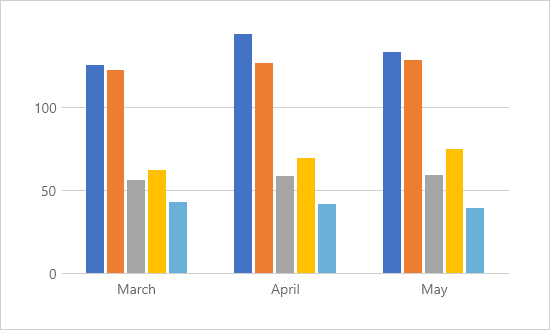
| None | Points are displayed side-by-side. |
|
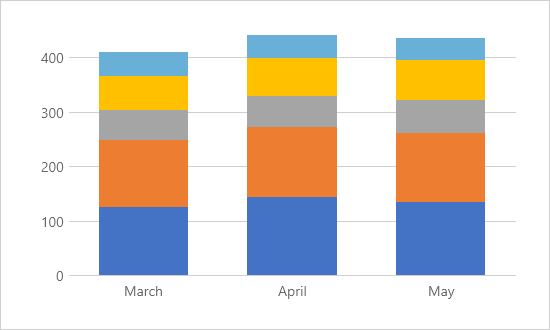
| Stacked | Points shown for the same argument are stacked. Values are summarized. |
|
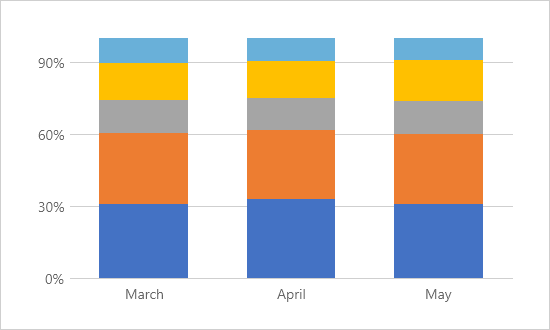
| FullStacked | Points shown for the same argument are stacked. A stacked group height is equal to the y-axis length. Point values are shown as a percentage where 100% is the sum of all values associated with the argument. |
|
Remarks
You can split stacked bars in the same argument group into multiple groups. To do this, specify the series view’s StackedGroup property to define the series’ target group.
Example
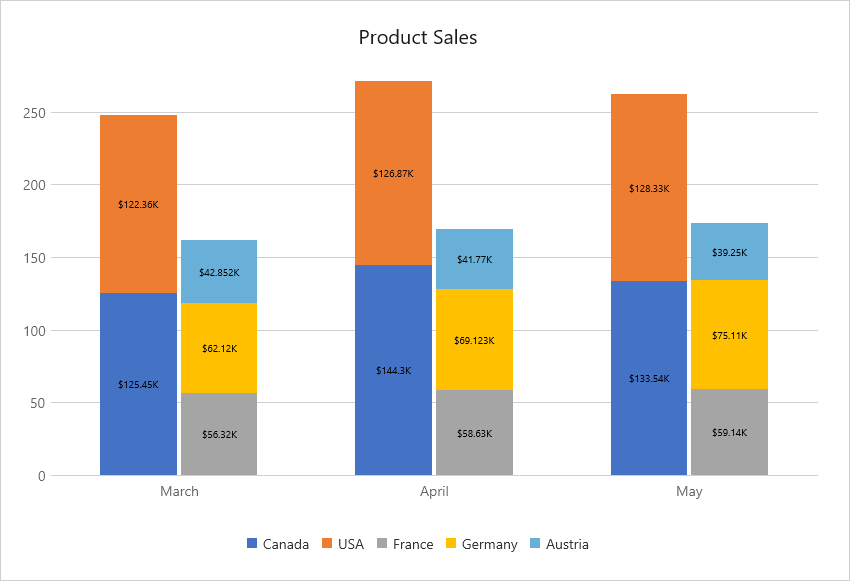
The following example shows how to create a side-by-side stacked bar chart. In this example, series are created based on a collection of series view models.
- Use the ChartBase.SeriesSource property to bind the chart to a collection that contains series view models.
Define the ChartBase.SeriesItemTemplate property to specify how to convert view model objects to series. To do this, initialize the
SeriesItemTemplateproperty with aDataTemplateobject. Add a Series object to the data template.Note: Use the ChartBase.SeriesItemTemplateSelector property if you need to select a series template based on a condition.
Then, you need to specify how series obtain data from the source. To do this, initialize the Series.Data with a DataSource object. Specify the following data source properties:
To visualize data source points as bars, set the Series.View property to a BarSeriesView object. To create a single bar from separate bar points shown for the same argument, set the StackedMode property to Stacked.
You can also divide stacked bars in the same argument group into multiple groups. To do this, specify the BarSeriesView.StackedGroup property to define the target stacked group for the series.
<Window
    x:Class="StackedSeriesChart.MainWindow"
    xmlns="http://schemas.microsoft.com/winfx/2006/xaml/presentation"
    xmlns:x="http://schemas.microsoft.com/winfx/2006/xaml"
    xmlns:local="using:StackedSeriesChart"
    xmlns:d="http://schemas.microsoft.com/expression/blend/2008"
    xmlns:mc="http://schemas.openxmlformats.org/markup-compatibility/2006"
    xmlns:Charts="using:DevExpress.WinUI.Charts"
    mc:Ignorable="d">
    <Grid>
        <Grid.DataContext>
            <local:ChartViewModel/>
        </Grid.DataContext>
        <TextBlock Text="Product Sales"
                   HorizontalTextAlignment="Center"
                   Margin="0,50,0,0"
                   FontSize="20"/>
        <Charts:CartesianChart x:Name="chart"
                               ToolTipEnabled="True"
                               Padding="0"
                               SeriesSource="{Binding SeriesData}">
            <Charts:CartesianChart.SeriesItemTemplate>
                <DataTemplate>
                    <Charts:Series DisplayName="{Binding Name}">
                        <Charts:Series.Data>
                            <Charts:DataSource PointSource="{Binding DataPoints}"
                                               ArgumentDataMember="Argument"
                                               ValueDataMember="Value"/>
                        </Charts:Series.Data>
                        <Charts:Series.View>
                            <Charts:BarSeriesView StackedMode="Stacked"
                                                  StackedGroup="{Binding Group}"
                                                  ShowLabels="True"
                                                  LabelPattern="{}${V}K">
                                <Charts:BarSeriesView.LabelTemplate>
                                    <DataTemplate>
                                        <TextBlock Text="{Binding Text}"
                                                   Foreground="Black"
                                                   FontSize="10"/>
                                    </DataTemplate>
                                </Charts:BarSeriesView.LabelTemplate>
                            </Charts:BarSeriesView>
                        </Charts:Series.View>
                    </Charts:Series>
                </DataTemplate>
            </Charts:CartesianChart.SeriesItemTemplate>
            <Charts:CartesianChart.Legend>
                <Charts:Legend />
            </Charts:CartesianChart.Legend>
        </Charts:CartesianChart>
    </Grid>
</Window>
using DevExpress.Mvvm;
using Microsoft.UI.Xaml;
using System.Collections.Generic;

namespace StackedSeriesChart {

    public sealed partial class MainWindow : Window {
        public MainWindow() {
            this.InitializeComponent();
        }
    }
    public class ChartViewModel : ViewModelBase {
        public List<SeriesViewModel> SeriesData { get; }
        public ChartViewModel() {
            List<SeriesViewModel> seriesData = new List<SeriesViewModel> {
                new SeriesViewModel{ Name = "Canada", Group = 0,
                    DataPoints = new List<DataPoint> {
                        new DataPoint{ Argument = "March", Value = 125.45 },
                        new DataPoint{ Argument = "April", Value = 144.3 },
                        new DataPoint{ Argument = "May", Value = 133.54 }
                    }
                },
                new SeriesViewModel{ Name = "USA", Group = 0,
                    DataPoints = new List<DataPoint> {
                        new DataPoint{ Argument = "March", Value = 122.36 },
                        new DataPoint{ Argument = "April", Value = 126.87 },
                        new DataPoint{ Argument = "May", Value = 128.33 }
                    }
                },
                new SeriesViewModel{ Name = "France", Group = 1,
                    DataPoints = new List<DataPoint> {
                        new DataPoint{ Argument = "March", Value = 56.32 },
                        new DataPoint{ Argument = "April", Value = 58.63 },
                        new DataPoint{ Argument = "May", Value = 59.14 }
                    }
                },
                new SeriesViewModel{ Name = "Germany", Group = 1,
                    DataPoints = new List<DataPoint> {
                        new DataPoint{ Argument = "March", Value = 62.12 },
                        new DataPoint{ Argument = "April", Value = 69.123 },
                        new DataPoint{ Argument = "May", Value = 75.11 }
                    }
                },
                new SeriesViewModel{ Name = "Austria", Group = 1,
                    DataPoints = new List<DataPoint> {
                        new DataPoint{ Argument = "March", Value = 42.852 },
                        new DataPoint{ Argument = "April", Value = 41.77 },
                        new DataPoint{ Argument = "May", Value = 39.25 }
                    }
                }
            };
            SeriesData = seriesData;
        }
    }
    public class SeriesViewModel {
        public int Group { get; set; }
        public string Name { get; set; }
        public List<DataPoint> DataPoints { get; set; }
    }
    public class DataPoint {
        public string Argument { get; set; }
        public double Value { get; set; }

    }
}