How to: Create a Chart Using the Instant Layout Assistant (for VS 2015 and earlier)
- 2 minutes to read
This example shows how to add a ChartControl to a WPF application and create a simple Pie chart with a series using the Instant Layout Assistant. You can also use the Instant Layout Assistant to create a Cartesian Chart (Side-by-Side Bar, Area), Cartesian 3D-Chart (Area 3D), Pie 3D-Chart (3D-Pie), Radar Chart (Radar Area) and Finance Chart (Candle Stick).
Follow the steps below to add a Chart control to your WPF application and create a Pie chart with series labels:
- Run MS Visual Studio 2010, 2012, 2013 or 2015. Note that Microsoft Visual Studio 2017 does not support the Instant Layout Assistant.
Create a new WPF Application project or open an existing one.
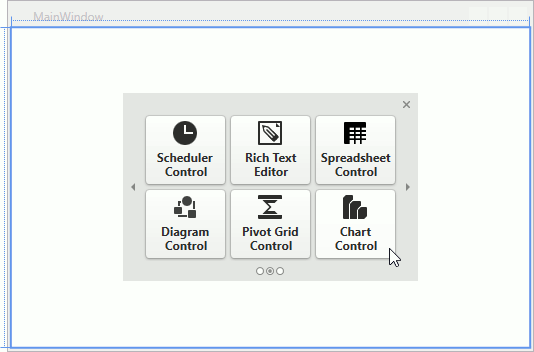
The Instant Layout Assistant appears in the designer window’s center.
Important
If this does not happen, enable the assistant by selecting the DEVEXPRESS | WPF Controls v19.2 | Enable Instant Layout Assistant category in the Visual Studio menu.
Click the Chart Control item in the Instant Layout Assistant.
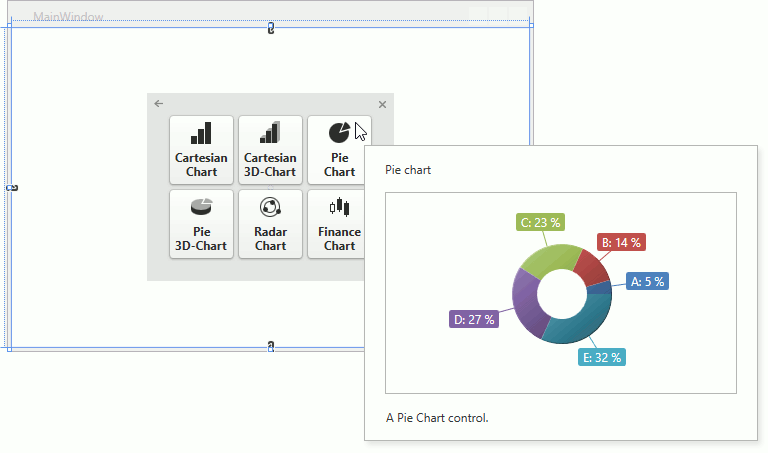
Click Pie Chart in the next assistant’s window.
This generates the following XAML.
<Window xmlns="http://schemas.microsoft.com/winfx/2006/xaml/presentation"
        xmlns:x="http://schemas.microsoft.com/winfx/2006/xaml"
        xmlns:d="http://schemas.microsoft.com/expression/blend/2008"
        xmlns:mc="http://schemas.openxmlformats.org/markup-compatibility/2006"
        xmlns:local="clr-namespace:PieChartExample"
        xmlns:dxc="http://schemas.devexpress.com/winfx/2008/xaml/charts"
        x:Class="PieChartExample.MainWindow"
        mc:Ignorable="d"
        Title="MainWindow" Height="350" Width="525">
    <Grid>
        <dxc:ChartControl>
            <dxc:ChartControl.Titles>
                <dxc:Title Content="Pie Chart"
                           HorizontalAlignment="Center"/>
            </dxc:ChartControl.Titles>
            <dxc:SimpleDiagram2D>
                <dxc:PieSeries2D LabelsVisibility="True">
                    <dxc:PieSeries2D.Label>
                        <dxc:SeriesLabel Indent="15"
                                         TextPattern="{}{A}: {VP:p0}"/>
                    </dxc:PieSeries2D.Label>
                    <dxc:SeriesPoint Argument="A" Value="1"/>
                    <dxc:SeriesPoint Argument="B" Value="3"/>
                    <dxc:SeriesPoint Argument="C" Value="5"/>
                    <dxc:SeriesPoint Argument="D" Value="6"/>
                    <dxc:SeriesPoint Argument="E" Value="7"/>
                </dxc:PieSeries2D>
            </dxc:SimpleDiagram2D>
        </dxc:ChartControl>
    </Grid>
</Window>
Run the application.
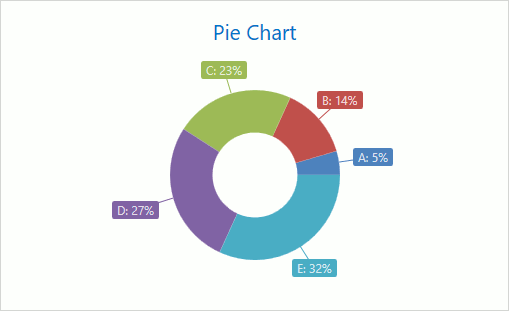
The following image illustrates the resulting chart at runtime.