Chart3D Control
- 2 minutes to read
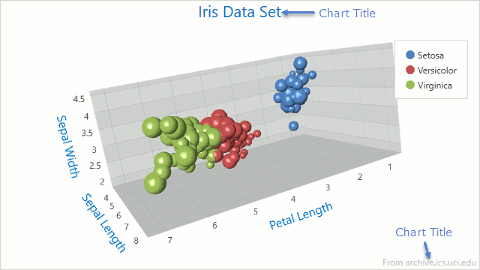
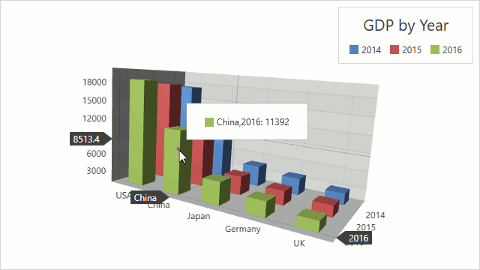
The DevExpress Chart3D Control for WPF visualizes data as bars, points, surface or bubbles in a three-dimensional Cartesian coordinate system where two dimensions represent data arguments and the third dimension - the value.
| This section contains tutorials that show how to use the DevExpress Chart3DControl for WPF. |
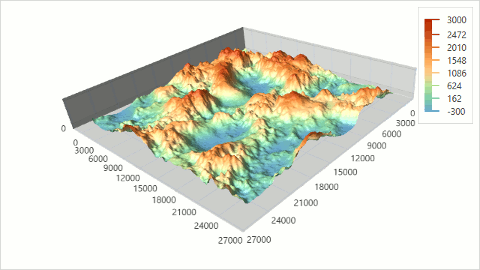
| A Series is the Chart3D control’s main element and represents a collection of data points within the chart. The series view specifies how the series’s data appears in the chart. |
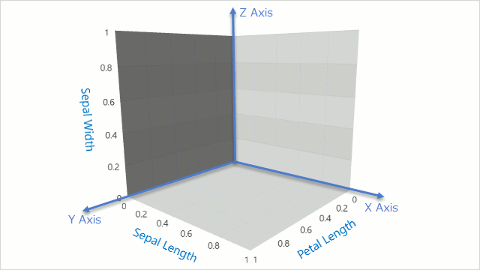
| The Chart3D control’s axis elements like titles, axis labels, grid lines and tick marks, can be configured. For instance, axis titles and grid lines can be shown or hidden, and axis ranges can be defined. |
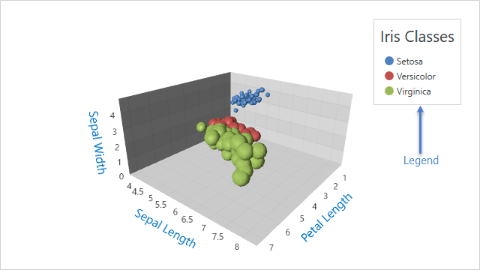
| The Chart3D control can contain an unlimited number of legends. Legends can display information about series, their colorized point markers or surface fill styles. |
| Chart titles display additional information that describes the chart’s content. You can add any number of titles to the chart and customize their appearance and position. |
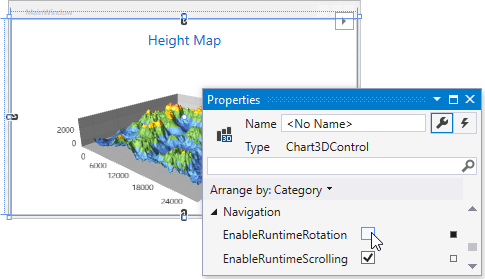
| The Chart3D is an interactive control that allows end-users to rotate, move and scale the chart. Users can also track data point values using the Chart3D Control’s Crosshair Cursor. |