A newer version of this page is available. .

Charts Suite

The DevExpress ChartControl and Chart3DControl for WPF are powerful visualization tools that allow you to visualize your data in a 2D or 3D space.

Chart Control

ChartSuite-ChartControl

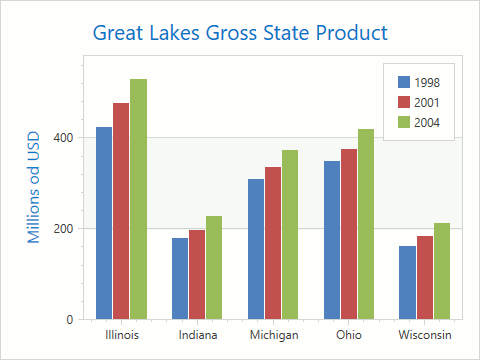
The DevExpress Chart Control for WPF helps you display your data as 2D or pseudo 3D bars, areas, lines and many other forms.

Features include:

  • Flexible binding options.
  • Legends.
  • Titles.
  • Multiple axes and panes.
  • Interactivity (Crosshair, tooltips, runtime zooming and scrolling, etc)

Chart3D Control

ChartSuite-Chart3DControl

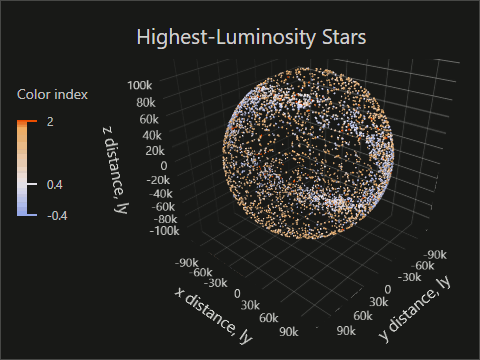
The DevExpress Chart Control allows you to visualize 3D data sets as Surface, 3D Bars, 3D Scatter Points or Bubbles.

Features include:

  • Flexible binding options.
  • Built-in series colorization algorithms.
  • Legends.
  • Titles.
  • Interactivity (Crosshair, hit-testing, runtime interaction, etc).
See Also