TdxChartXYSeriesUnboundDataBinding Class
Stores data binding settings for an XY series in unbound data access mode.
Declaration
TdxChartXYSeriesUnboundDataBinding = class(
    TdxChartSeriesUnboundDataBinding
)
Remarks
An XY series is in unbound mode when its DataBindingType property is set to 'Unbound'. In this mode, you can call Points.Add methods to populate the series with data points. The ArgumentField and ValueField properties define data types of arguments and values in series data points, respectively.
The DataBinding property of an XY series references the TdxChartXYSeriesUnboundDataBinding class as a TdxChartSeriesCustomDataBinding object if the DataBindingType property of the series is set to 'Unbound'.
Note
You need to cast the DataBinding property to the TdxChartXYSeriesUnboundDataBinding class to access the ArgumentField and ValueField properties.
Example
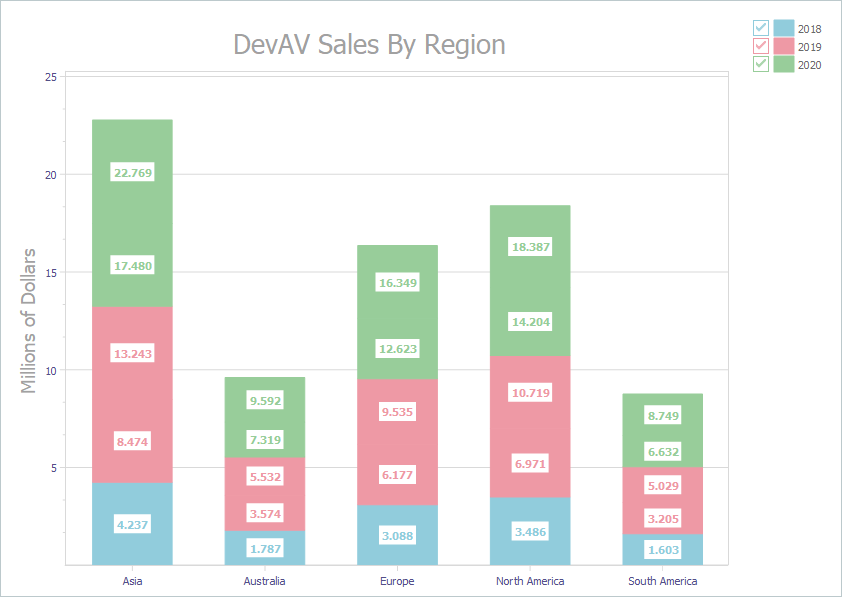
The following code example creates three stacked bar series with identical appearance settings in unbound data access mode:
var
  AXYDiagram: TdxChartXYDiagram;
  AXY2018Series, AXY2019Series, AXY2020Series: TdxChartXYSeries;
  AStackedBarView: TdxChartXYSeriesStackedBarView;
begin
  dxChartControl1.BeginUpdate;  // Initiates the following batch change
  try
    AXYDiagram := dxChartControl1.AddDiagram<TdxChartXYDiagram>('DevAV Sales By Region');
    AXYDiagram.Title.Appearance.FontOptions.Size := 20;
    AXYDiagram.Axes.AxisY.Title.Text := 'Millions of Dollars';
    AXYDiagram.Axes.AxisY.Title.Appearance.FontOptions.Size := 14;
    AXY2018Series := AXYDiagram.AddSeries('2018');  // Creates a new series with the caption "2018"
    AXY2018Series.DataBindingType := 'Unbound';  // Selects the unbound data access mode
    // Changes the argument field type to "string"
    TdxChartXYSeriesUnboundDataBinding(AXY2018Series.DataBinding).ArgumentField.ValueType := 'string';
    AXY2018Series.ViewType := 'StackedBar';  // Selects the Stacked Bar series View
    AStackedBarView := AXY2018Series.View as TdxChartXYSeriesStackedBarView;
    AStackedBarView.ValueLabels.Visible := True;  // Displays value labels on bars
    AStackedBarView.ValueLabels.NumberFormat := '0.000';  // Changes the number display format
    AStackedBarView.ValueLabels.Appearance.FontOptions.Bold := True;
    AXY2018Series.Points.Add('Asia', 4.2372);
    AXY2018Series.Points.Add('Australia', 1.7871);
    AXY2018Series.Points.Add('Europe', 3.0884);
    AXY2018Series.Points.Add('North America', 3.4855);
    AXY2018Series.Points.Add('South America', 1.6027);
    AXY2019Series := AXYDiagram.AddSeries;  // Creates a new series with the default settings
    AXY2019Series.AssignFrom(AXY2018Series);  // Copies all settings from the "2018" series
    AXY2019Series.Caption := '2019';  // Defines a different series caption
    AXY2019Series.Points.Add('Asia', 4.7685);
    AXY2019Series.Points.Add('Australia', 1.9576);
    AXY2019Series.Points.Add('Europe', 3.3579);
    AXY2019Series.Points.Add('North America', 3.7477);
    AXY2019Series.Points.Add('South America', 1.8237);
    AXY2020Series := AXYDiagram.AddSeries('2020');  // Creates a new series with the default settings
    AXY2020Series.AssignFrom(AXY2018Series);  // Copies all settings from the "2018" series
    AXY2020Series.Caption := '2020';  // Defines a different series caption
    AXY2020Series.Points.Add('Asia', 5.289);
    AXY2020Series.Points.Add('Australia', 2.2727);
    AXY2020Series.Points.Add('Europe', 3.7257);
    AXY2020Series.Points.Add('North America', 4.1825);
    AXY2020Series.Points.Add('South America', 2.1172);
  finally
    dxChartControl1.EndUpdate;  // Calls EndUpdate regardless of the batch operation's success
  end;
end;