TdxChartSeriesUnboundDataBinding.ArgumentField Property
Specifies data-related settings of series arguments in unbound mode.
Declaration
property ArgumentField: TdxChartSeriesUnboundField read; write;Property Value
| Type | Description |
|---|---|
| TdxChartSeriesUnboundField | Stores data-related settings of series arguments. |
Remarks
Use the ArgumentField.ValueType or ArgumentField.ValueTypeClass property to change the data type of argument values. The following table lists supported value types and the corresponding property values:
| ValueType[1] Value | ValueTypeClass[2] Value | TFieldType[3] Value | Description |
|---|---|---|---|
'String' |
TcxStringValueType | ftString |
Unicode string values. |
'WideString' |
TcxWideStringValueType | ftWideString |
Wide string values. |
'Smallint' |
TcxSmallintValueType | ftSmallint |
16-bit signed integer values. |
'Integer' |
TcxIntegerValueType | ftInteger |
32-bit signed integer values. |
'Word' |
TcxWordValueType | ftWord |
16-bit unsigned integer values. |
'Boolean' |
TcxBooleanValueType | ftBoolean |
Boolean values. |
'Single' |
TcxSingleValueType | ftSingle |
Single precision floating-point values. |
'Float' |
TcxFloatValueType | ftFloat |
Double precision floating-point values. |
'Currency' |
TcxCurrencyValueType | ftCurrency |
Monetary values. |
'DateTime' |
TcxDateTimeValueType | ftDateTime |
Date and time values. |
'LargeInt' |
TcxLargeIntValueType | ftLargeInt |
64-bit signed integer values. |
'FMTBcd' |
TcxFMTBcdValueType | ftFMTBcd |
Binary-encoded decimal values that can be converted to Currency without a loss of precision. |
'SQLTimeStamp' |
TcxSQLTimeStampValueType | ftTimeStamp[4] |
High-precision date and time values. |
'Variant' |
TcxVariantValueType | ftVariant |
Values of any type. |
'BLOB'[5] |
TcxBLOBValueType | fsBlob |
BLOBs (Binary Large OBjects) as values. BLOB values are most often used for storing files in a database. |
'Object'[6] |
TcxObjectValueType | ftObject |
Values that store non-visual objects (TObject descendant instances) with arbitrary data for an unbound editor or Data Grid item. |
Example
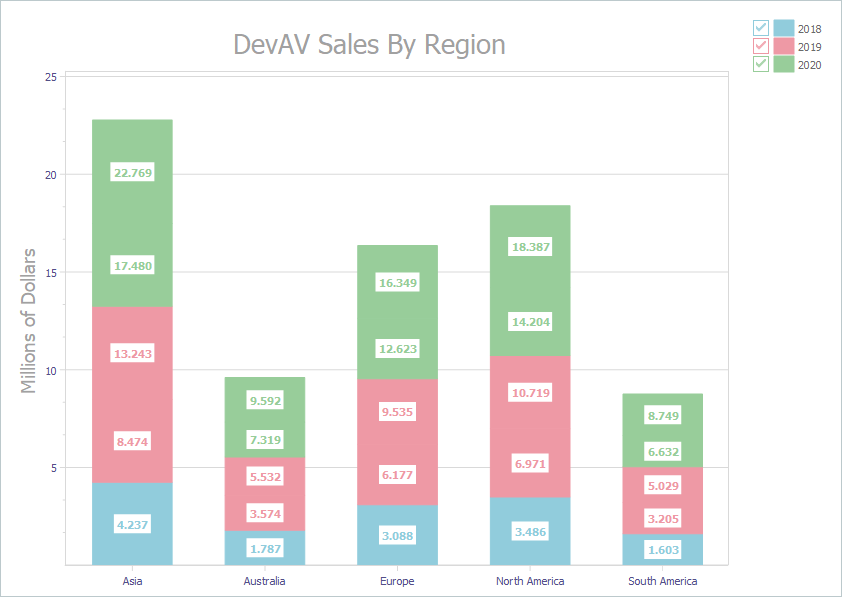
The following code example creates three stacked bar series with identical appearance settings in unbound data access mode:
var
  AXYDiagram: TdxChartXYDiagram;
  AXY2018Series, AXY2019Series, AXY2020Series: TdxChartXYSeries;
  AStackedBarView: TdxChartXYSeriesStackedBarView;
begin
  dxChartControl1.BeginUpdate;  // Initiates the following batch change
  try
    AXYDiagram := dxChartControl1.AddDiagram<TdxChartXYDiagram>('DevAV Sales By Region');
    AXYDiagram.Title.Appearance.FontOptions.Size := 20;
    AXYDiagram.Axes.AxisY.Title.Text := 'Millions of Dollars';
    AXYDiagram.Axes.AxisY.Title.Appearance.FontOptions.Size := 14;
    AXY2018Series := AXYDiagram.AddSeries('2018');  // Creates a new series with the caption "2018"
    AXY2018Series.DataBindingType := 'Unbound';  // Selects the unbound data access mode
    // Changes the argument field type to "string"
    TdxChartXYSeriesUnboundDataBinding(AXY2018Series.DataBinding).ArgumentField.ValueType := 'string';
    AXY2018Series.ViewType := 'StackedBar';  // Selects the Stacked Bar series View
    AStackedBarView := AXY2018Series.View as TdxChartXYSeriesStackedBarView;
    AStackedBarView.ValueLabels.Visible := True;  // Displays value labels on bars
    AStackedBarView.ValueLabels.NumberFormat := '0.000';  // Changes the number display format
    AStackedBarView.ValueLabels.Appearance.FontOptions.Bold := True;
    AXY2018Series.Points.Add('Asia', 4.2372);
    AXY2018Series.Points.Add('Australia', 1.7871);
    AXY2018Series.Points.Add('Europe', 3.0884);
    AXY2018Series.Points.Add('North America', 3.4855);
    AXY2018Series.Points.Add('South America', 1.6027);
    AXY2019Series := AXYDiagram.AddSeries;  // Creates a new series with the default settings
    AXY2019Series.AssignFrom(AXY2018Series);  // Copies all settings from the "2018" series
    AXY2019Series.Caption := '2019';  // Defines a different series caption
    AXY2019Series.Points.Add('Asia', 4.7685);
    AXY2019Series.Points.Add('Australia', 1.9576);
    AXY2019Series.Points.Add('Europe', 3.3579);
    AXY2019Series.Points.Add('North America', 3.7477);
    AXY2019Series.Points.Add('South America', 1.8237);
    AXY2020Series := AXYDiagram.AddSeries('2020');  // Creates a new series with the default settings
    AXY2020Series.AssignFrom(AXY2018Series);  // Copies all settings from the "2018" series
    AXY2020Series.Caption := '2020';  // Defines a different series caption
    AXY2020Series.Points.Add('Asia', 5.289);
    AXY2020Series.Points.Add('Australia', 2.2727);
    AXY2020Series.Points.Add('Europe', 3.7257);
    AXY2020Series.Points.Add('North America', 4.1825);
    AXY2020Series.Points.Add('South America', 2.1172);
  finally
    dxChartControl1.EndUpdate;  // Calls EndUpdate regardless of the batch operation's success
  end;
end;
-
The ValueType property setter updates the ValueTypeClass property according to the assigned value.
-
The ValueTypeClass property setter updates the ValueType property according to the assigned value.
-
This column lists the corresponding TFieldType values.
-
'SQLTimeStamp'also corresponds to the TSQLTimeStamp type. -
Use this value type with those controls and editors that support BLOB.
-
Use this type only in custom or inherited components because DevExpress and standard VCL components have no information on actual content of such values.