AxisLayout.Anchor2 Property
Gets or sets one of two endpoints of the axis.
Namespace: DevExpress.XamarinForms.Charts
Assembly: DevExpress.XamarinForms.Charts.dll
NuGet Package: DevExpress.XamarinForms.Charts
Declaration
public double Anchor2 { get; set; }Property Value
| Type | Description |
|---|---|
| Double | One of two endpoints of the axis, a double number from 0 to 1. |
Remarks
Anchor1 and Anchor2 properties specify the axis endpoints. Their default values equal 0 and 1, and in this case, the axis endpoints are placed at the edges of the ChartView diagram.
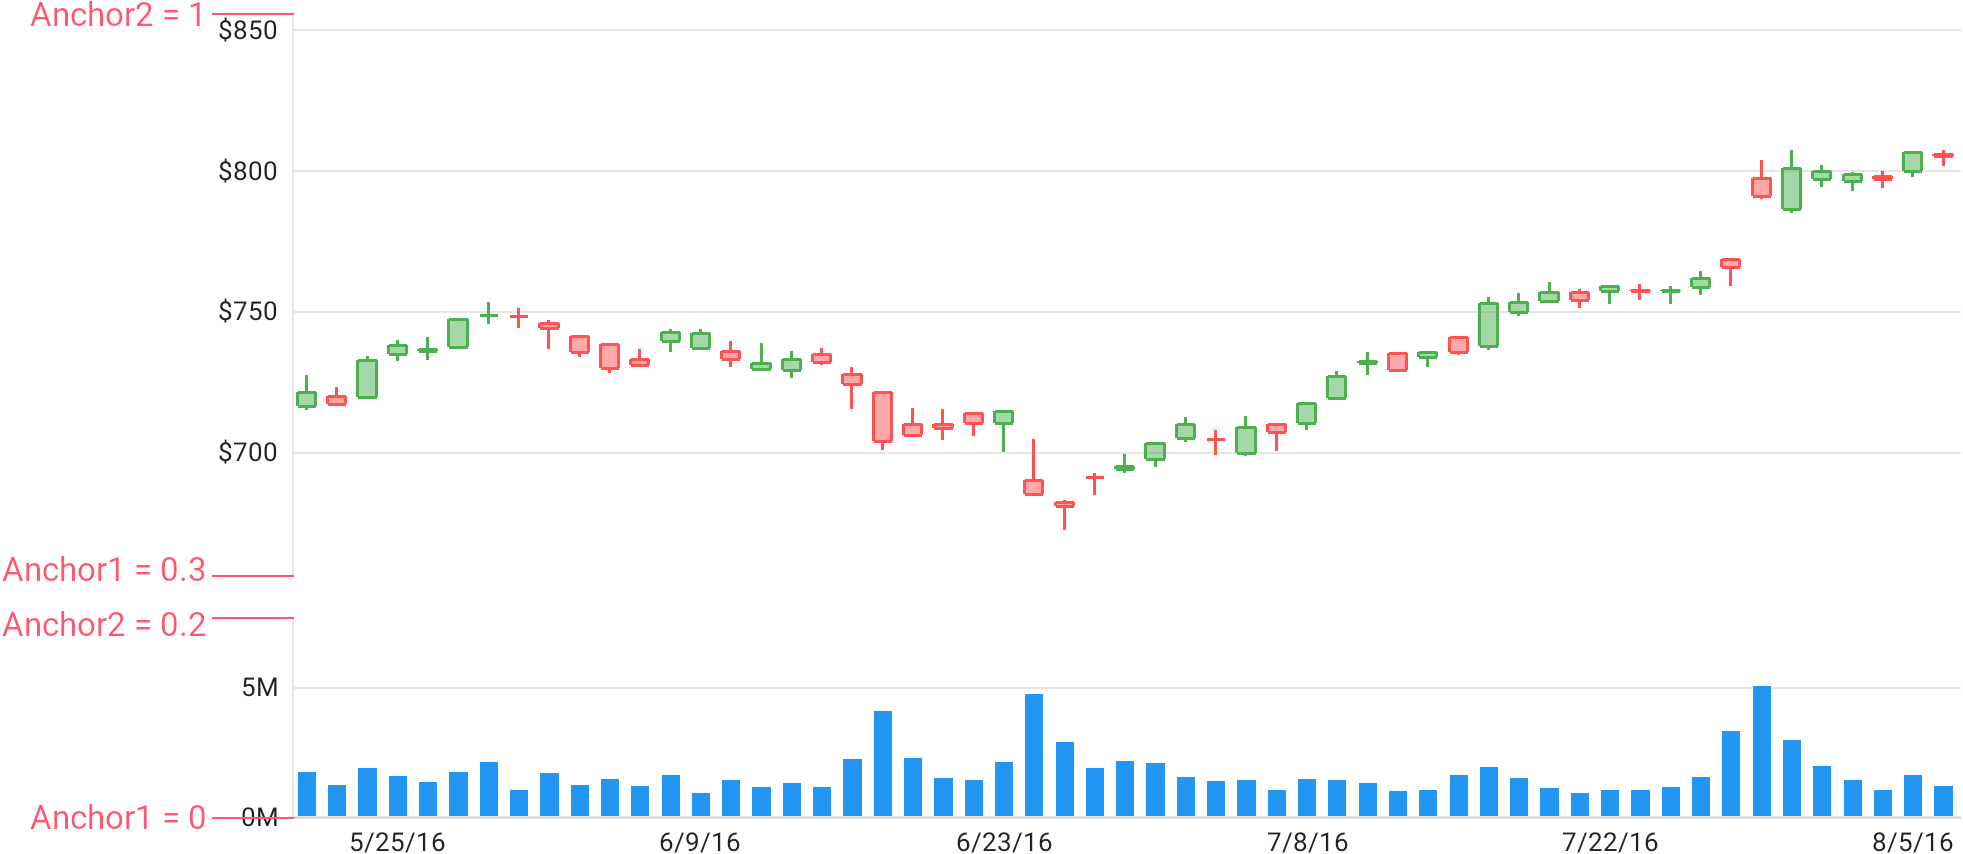
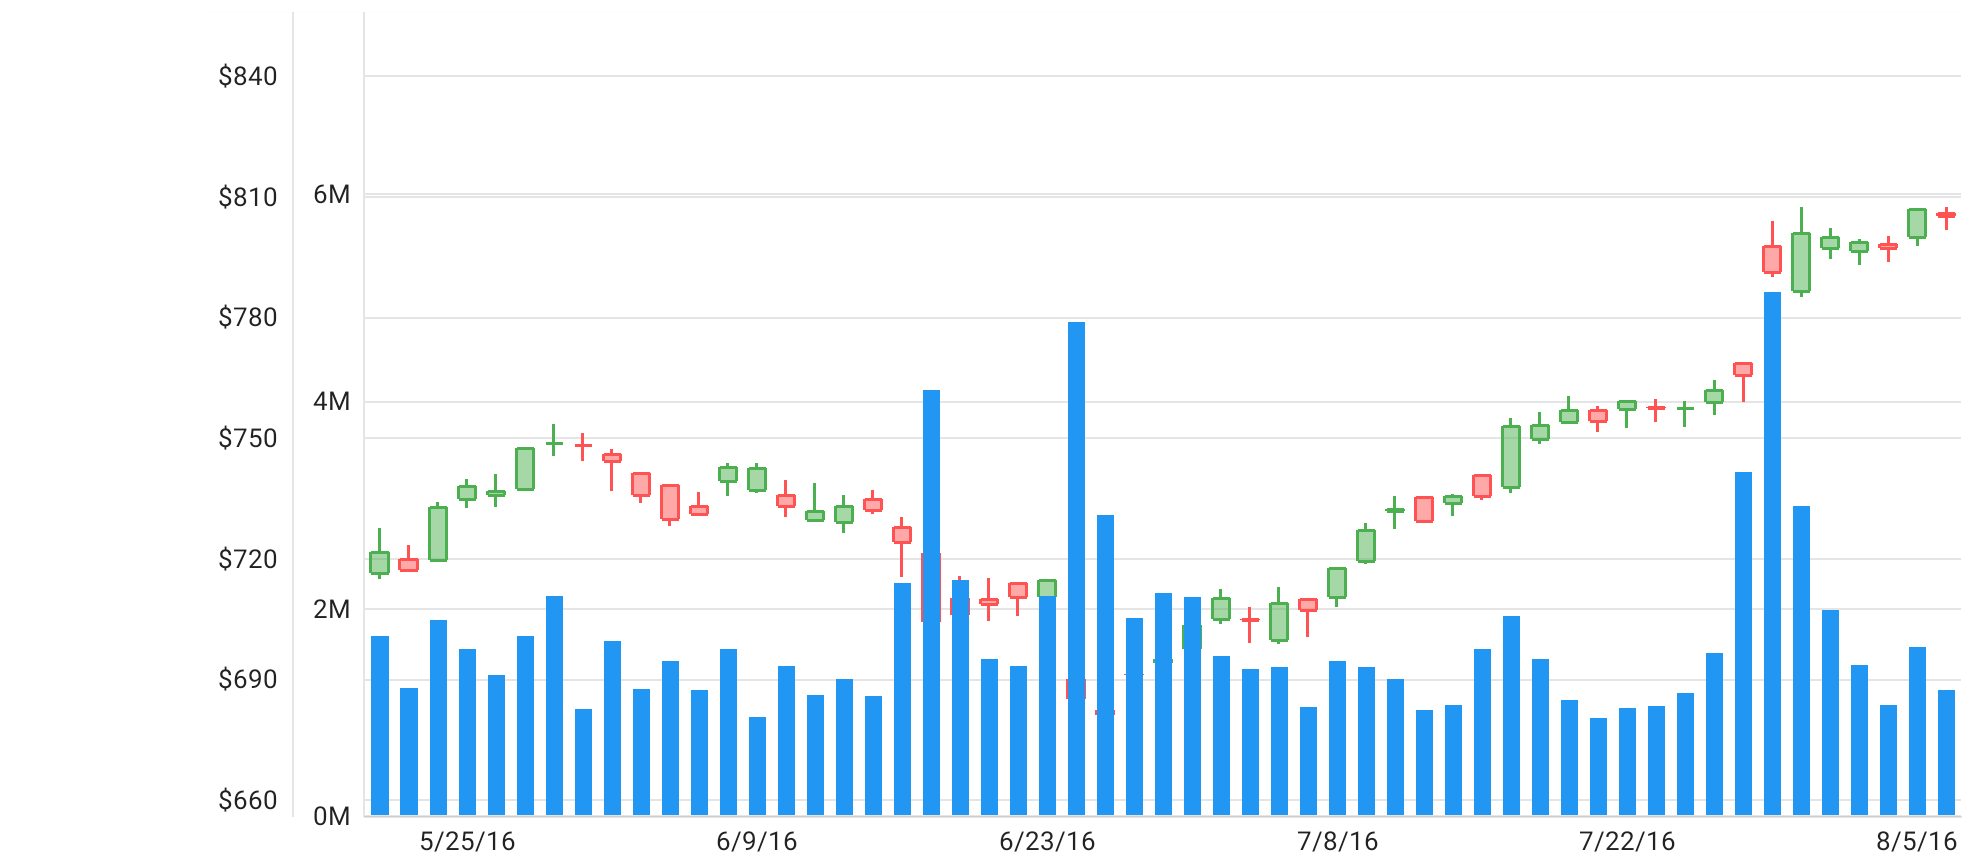
The chart can contain a few series types or a few series with different measure units. In this case, you can use the Anchor1 and Anchor2 properties to set an axis for each series to take up only a portion of the full axis length.
Example
This example demonstrates how to fit two series of different types into one chart. Create a new AxisLayout object, set its Anchor1 and Anchor2 properties to number values from 0 to 1, and assign it to the Layout property of the axis.
<dxc:ChartView>
    <dxc:ChartView.Series>
        <dxc:CandleStickSeries>
            <!--...-->
        </dxc:CandleStickSeries>
        <dxc:BarSeries>
            <dxc:BarSeries.AxisY>
                <dxc:NumericAxisY AlwaysShowZeroLevel="false">
                    <dxc:NumericAxisY.Layout>
                        <dxc:AxisLayout Anchor1="0"
                                        Anchor2="0.2" />
                        <!--If you set Anchor1="0.2" and Anchor2="0" the result will be the same.-->
                    </dxc:NumericAxisY.Layout>
                    <dxc:NumericAxisY.Label>
                        <dxc:AxisLabel Position="Outside"
                                       TextFormat="#M"/>
                    </dxc:NumericAxisY.Label>
                </dxc:NumericAxisY>
            </dxc:BarSeries.AxisY>
        </dxc:BarSeries>
    </dxc:ChartView.Series>

    <dxc:ChartView.AxisY>
        <dxc:NumericAxisY AlwaysShowZeroLevel="false">
            <dxc:NumericAxisY.Layout>
                <dxc:AxisLayout Anchor1="0.3"
                                Anchor2="1" />
            </dxc:NumericAxisY.Layout>
            <dxc:NumericAxisY.Label>
                <dxc:AxisLabel Position="Outside"
                               TextFormat="$#"/>
            </dxc:NumericAxisY.Label>
        </dxc:NumericAxisY>
    </dxc:ChartView.AxisY>
    <dxc:ChartView.AxisX>
        <!--...-->
    </dxc:ChartView.AxisX>
</dxc:ChartView>

