Cartesian Chart
- 7 minutes to read
The DevExpress Chart view allows you to visualize your data in a Cartesian chart. The image below shows a Cartesian chart and highlights its major elements.
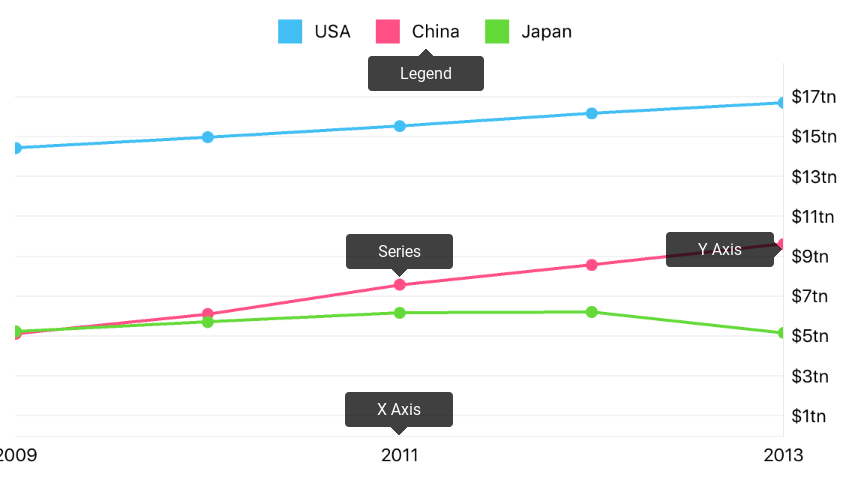
This guide describes specific operations the DXChart can perform.
How to: Modify chart series
The Chart visualizes data the series provides. Each series defines data appearance and behavior. Series, compatible with the Chart View, inherits the DXSeries class.
Note
The chart should be populated with data. Refer to the Series guide for more information.
The following code snippet shows how to add a series to a chart:
DXLineSeries *series = [[DXLineSeries alloc] init];
series.data = [GdpData dataWithArray:@[[Gdp withYear:2015 andValue:18.037],
                                       [Gdp withYear:2014 andValue:17.393],
                                       [Gdp withYear:2013 andValue:16.692],
                                       [Gdp withYear:2012 andValue:16.155],
                                       [Gdp withYear:2011 andValue:15.518],
                                       [Gdp withYear:2010 andValue:14.964],
                                       [Gdp withYear:2009 andValue:14.419],
                                       [Gdp withYear:2008 andValue:14.719]]];
[self.chart addSeries: series];

// Interfaces of the GdpData and Gdp classes.
@interface Gdp : NSObject
    @property int year;
    @property double value;

    +(instancetype)gdpWithYear: (int)year andValue: (double)value;
@end

@interface GdpData : NSObject <DXNumericSeriesData>
    +(instancetype)dataWithArray: (NSArray<Gdp *> *)gdps;
@end

// implementations of the Gdp and GdpData classes.
@implementation Gdp
+(instancetype)gdpWithYear:(int)year andValue:(double)value {
    Gdp *gdp = [[Gdp alloc] init];
    gdp.year = year;
    gdp.value = value;
    return gdp;
}
@end

@implementation GdpData {
    NSArray<Gdp *> *gdps;
}
+(instancetype)dataWithArray:(NSArray<Gdp *> *)gdps {
    GdpData *data = [[GdpData alloc] init];
    data->gdps = gdps;
    return data;
}

-(int)getDataCount {
    return (int)[gdps count];
}

-(double)getArgumentByIndex: (int) index {
    return [gdps objectAtIndex:index].year;
}

-(double)getValueByIndex: (int) index {
    return [gdps objectAtIndex:index].value;
}
@end
The following table contains methods allowing you to obtain, add or remove series of the chart:
| Method | Description |
|---|---|
| DXChart.series | Returns the array of series that the chart displays. |
| DXChart::addSeries: | Adds the specified new series to the chart. |
| DXChart::removeSeries: | Removes the specified series from the chart. |
| DXChart::removeSeriesAtIndex: | Removes a series at the specified index from the chart. |
How to: Manage chart axes
In addition to series, chart contains elements that allows you to configure how it looks and behaves. Axes are responsible for the coordinate space the chart visualize.
The following example demonstrates how to customize chart axes:
DXDateTimeAxisX *axisX = [[DXDateTimeAxisX alloc] init];
axisX.measureUnit = DXDateTimeMeasureUnitYear;
axisX.gridAlignment = DXDateTimeMeasureUnitYear;
axisX.gridOffset = 0;
axisX.gridSpacing = 1;
self.chart.axisX = axisX;

DXNumericAxisY *yAxis = [[DXNumericAxisY alloc] init];
axisY.gridAlignment = 1.0;
axisY.alwaysShowZeroLevel = NO;
self.hart.axisY = axisY;
The table below contains the main methods for configuring chart axes:
| Method | Description |
|---|---|
| DXChart.axisX | Gets or sets the chart’s X-axis (arguments axis). |
| DXChart.axisY | Gets or sets the chart’s Y-axis (values axis). |
| DXQualitativeAxisX | The qualitative arguments axis. |
| DXNumericAxisX | The numeric arguments axis. |
| DXDateTimeAxisX | The date-time arguments axis. |
| DXNumericAxisY | The numeric values axis. |
Refer to the Axes guide for more information about axes configuration.
How to: Configure a chart legend
The Legend identifies series and series points in a chart. The following example demonstrates the basic legend configuration:
DXLegend *legend = [[DXLegend init] alloc];
legend.horizontalPosition = DXLegendVerticalPositionCenter;
legend.verticalPosition = DXLegendVerticalPositionTopOutside;
legend.orientation = DXLegendOrientationLeftToRight;
self.chart.legend = legend;
The table below contains the main methods for configuring the legend:
| Method | Description |
|---|---|
| DXChartBase.legend | Gets or sets a chart’s legend settings. |
| DXLegend | The chart legend options storage. |
Refer to the Legend guide for more information about legend configuration.
How to: Scroll and zoom
In addition to common interactivity capabilities, the Cartesian Chart allows end-users to navigate on the chart coordinate space. The image below demonstrates this feature.
The following code example demonstrates how to enable zooming and scrolling along the X-axis and disable navigation along the Y axis, like on the image above:
self.chart.axisXNavigationMode = DXAxisNavigationModeScrollingAndZooming;
self.chart.axisYNavigationMode = DXAxisNavigationModeNone;
The code above uses the following methods:
| Method | Description |
|---|---|
| DXChart.axisXNavigationMode | Gets or sets the X-axis’s navigation mode. |
| DXChart.axisYNavigationMode | Gets or sets the Y-axis’s navigation mode. |
| DXAxisNavigationMode | Lists values specifying possible navigation modes of an axis. |
How to: Change chart appearance
Appearance of all chart elements including the Chart can be changed using styles. The following image demonstrates which chart parameters can be styled:
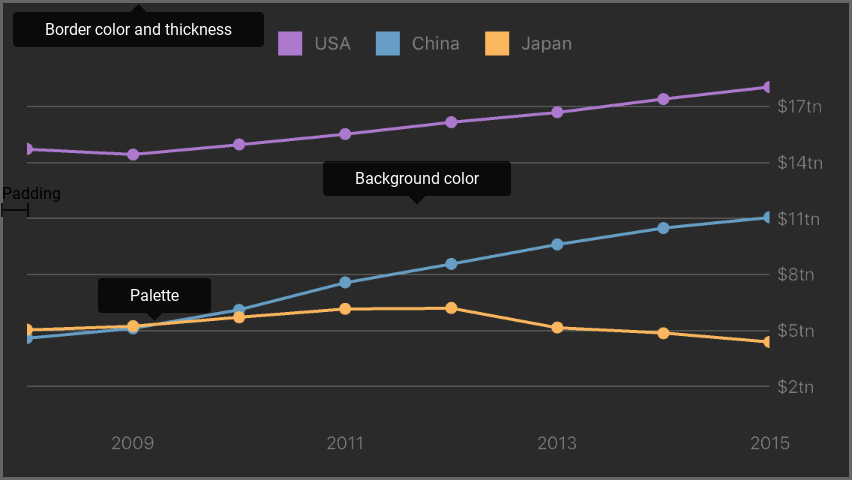
The following code snippet demonstrates how to obtain the image above:
DXChartStyle *chartStyle = [[DXChartStyle alloc] init];
chartStyle.borderColor = [UIColor colorWithWhite: 0.28627 alpha: 1.0];
chartStyle.borderThickness = 2;
chartStyle.backgroundColor = [UIColor colorWithWhite: 0.16471 alpha: 1.0];

self.chart.style = chartStyle;

// All sizes are in screen points.
DXPalette *palette = [[DXPalette alloc] init];
palette.colors = @[[UIColor colorWithRed: 0.67843 green: 0.47451 blue: 0.80784 alpha: 1.0],
                   [UIColor colorWithRed: 0.40392 green: 0.61961 blue: 0.77255 alpha: 1.0],
                   [UIColor colorWithRed: 0.98824 green: 0.71373 blue: 0.36863 alpha: 1.0];

DXChartStyle *chartStyle = [[DXChartStyle alloc] init];
chartStyle.backgroundColor = [UIColor colorWithWhite: 0.16471 alpha: 1.0];
chartStyle.borderColor = [UIColor colorWithWhite:0.4 alpha: 1];
chartStyle.borderThickness = 2;
chartStyle.padding = UIEdgeInsetsMake(16, 16, 16, 16);
chartStyle.palette = palette;

self.chart.style = chartStyle;
The following symbols allow you to configure chart style:
| Symbols | Description |
|---|---|
| style | Gets or sets the chart’s style. |
| DXChartStyle | The storage of the chart appearance settings. |
Note
A chart element’s style configures the element appearance. For example, use DXLegend.style to configure a legend appearance.