DXStackedAreaSeries Class
A series that displays data as areas on a diagram, in such way that the value of each data point is aggregated with the underlying data points’ values.
Declaration
@interface DXStackedAreaSeries: DXAreaSeriesRemarks
The following image represents Stacked Area series:
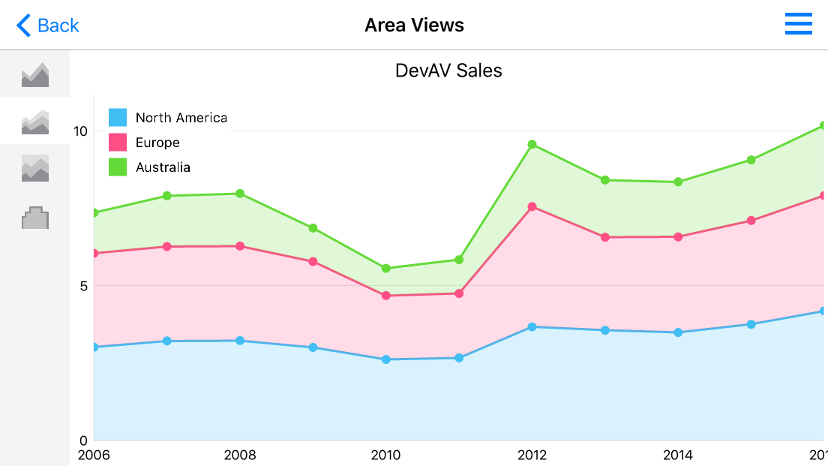
Note that, if any data point has a negative value, the chart replaces it by a zero value. If all values of all series are negative, a chart plots all series without ignoring values.
Inherited Members
Inheritance
NSObject
DXChartElement
DXSeriesBase
DXSeries
DXAreaSeries
DXStackedAreaSeries